[AI Readability Summary] This project combines an attention mechanism with LSTM for temperature time series forecasting, and uses Flask to provide an integrated workflow for training, evaluation, prediction, and visualization. It addresses the limitations of traditional methods in modeling long-term dependencies and leveraging critical time steps. Keywords: Attn-LSTM, temperature forecasting, Flask.
This system provides an end-to-end implementation for temperature time series forecasting
| Parameter | Description |
|---|---|
| Language | Python 3.10+ |
| Web Framework | Flask |
| Deep Learning Framework | PyTorch |
| Data Processing | Pandas, NumPy, Scikit-learn |
| Visualization | Matplotlib, Seaborn, Plotly |
| Task Type | Time Series Regression / Temperature Forecasting |
| Models | Attn-LSTM, LSTM, Persistence |
| Evaluation Metrics | MAE, RMSE, R², MASE |
| Stars | Not provided in the source material |
| Core Dependencies | torch, flask, pandas, numpy, scikit-learn |
The core goal of this project is not just to train a single model, but to build a runnable, interpretable, and presentable temperature forecasting system. It covers data cleaning, feature construction, sample generation, model training, metric evaluation, and web-based presentation, making it well suited for time series forecasting coursework or engineering prototypes.
Compared with traditional statistical methods, this solution emphasizes two things: first, using LSTM to model long-term dependencies; second, using an attention mechanism to identify more important historical time steps. However, the original experiments also show that attention does not necessarily deliver higher accuracy, which is a valuable engineering conclusion.
The system architecture is jointly powered by Flask and PyTorch
The system uses a layered design: the frontend handles user interaction, Flask manages routing and business orchestration, PyTorch handles model training and inference, and the utility layer is responsible for data loading, validation, and normalization. This architecture decouples algorithms from presentation, making it easier to replace models or extend data sources later.
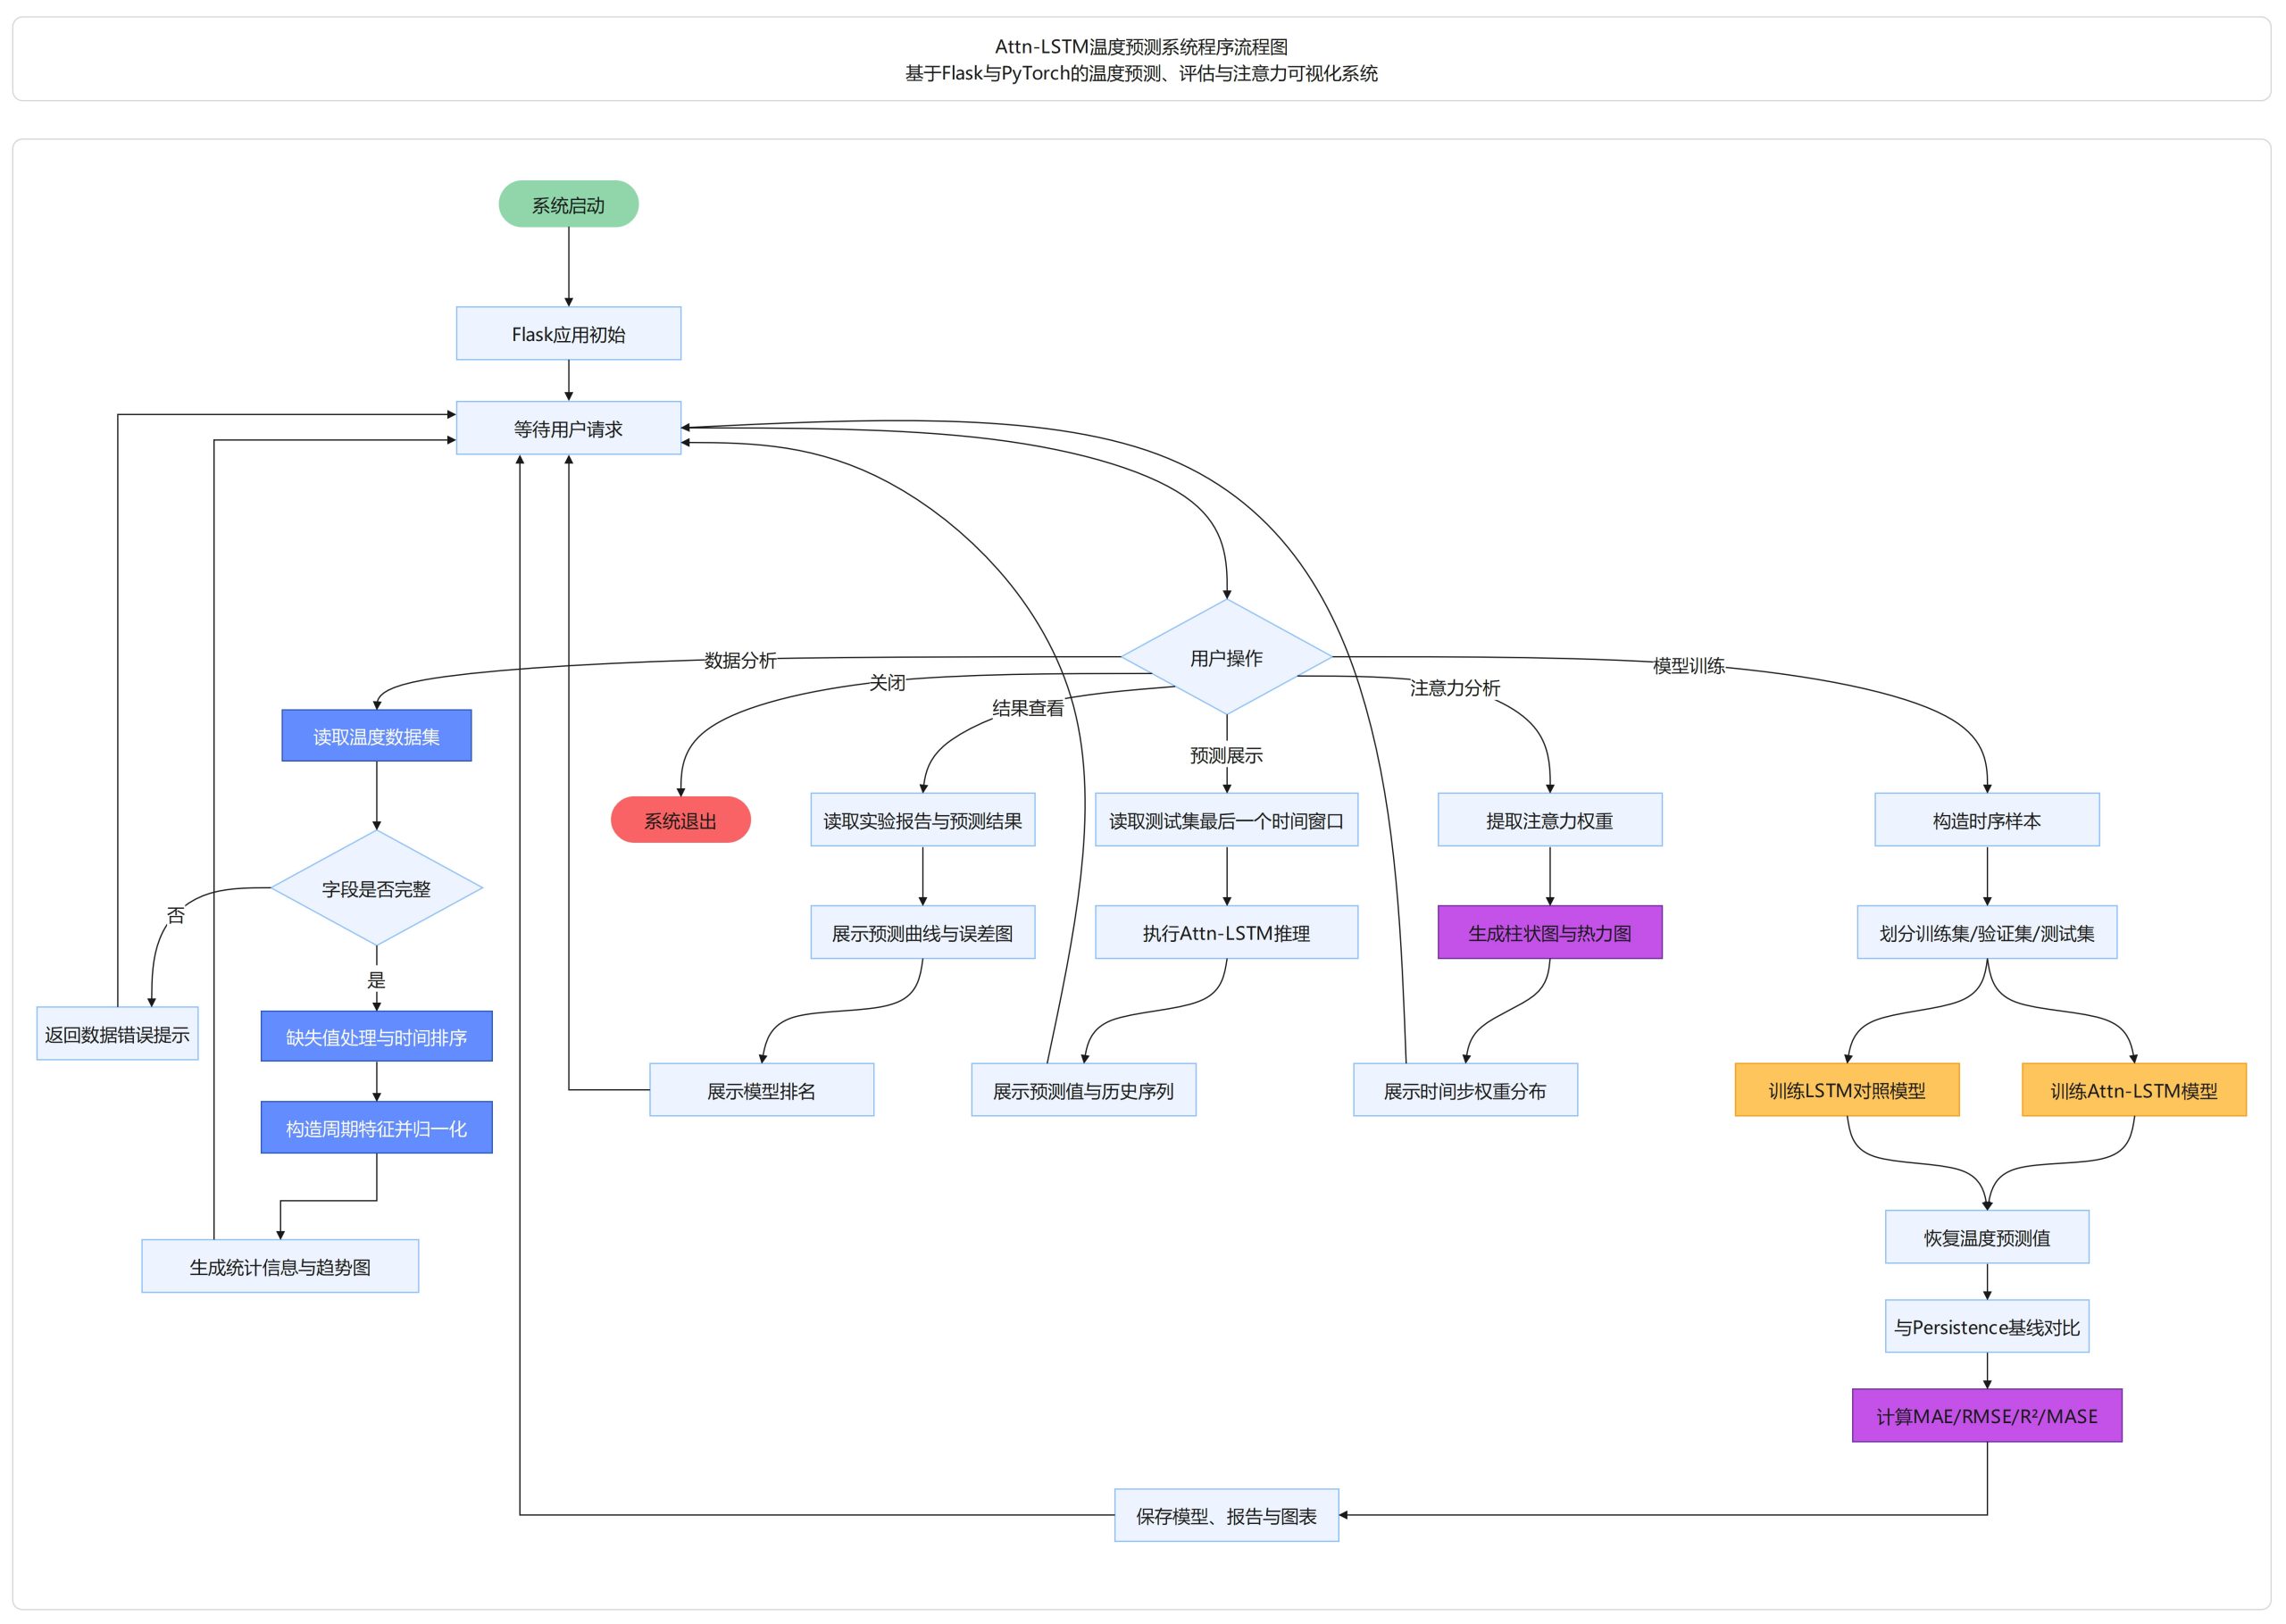
AI Visual Insight: This diagram shows a typical layered architecture for a time series forecasting system. Users initiate data analysis, model training, and prediction requests from the web interface. Flask dispatches those requests to data preprocessing, Attn-LSTM training, evaluation, and visualization modules. The system then outputs forecast curves, error analysis, and attention heatmaps, illustrating the separation between frontend and backend as well as algorithm service orchestration.
The data processing pipeline determines the upper bound of forecasting performance
The project uses weather data recorded by date, including fields such as average temperature, maximum temperature, minimum temperature, precipitation, wind speed, and pressure. The preprocessing workflow includes field validation, missing value handling, chronological sorting, and invalid column removal. The goal is to ensure the data is usable before entering the modeling stage.
To help the model understand seasonality, the system additionally constructs cyclical features such as month and day of year. It then uses a sliding window to convert continuous historical segments into supervised learning samples, and sets the prediction target as the change in average temperature at the next time step relative to the previous one. This incremental forecasting strategy helps stabilize training.
import pandas as pd
from sklearn.preprocessing import MinMaxScaler

# Read data and sort by time
 df = pd.read_csv("weather.csv")
df["date"] = pd.to_datetime(df["date"])  # Convert the date column to datetime
df = df.sort_values("date").dropna()      # Sort chronologically and remove missing values

# Construct cyclical features
 df["month"] = df["date"].dt.month        # Extract the month feature
df["dayofyear"] = df["date"].dt.dayofyear # Extract the day-of-year feature

features = ["temp_avg", "temp_min", "temp_max", "rain", "wind", "pressure", "month", "dayofyear"]
scaler = MinMaxScaler()
df[features] = scaler.fit_transform(df[features])  # Normalize input features
This code snippet demonstrates a minimal closed loop for chronological sorting, cyclical feature construction, and Min-Max normalization.
The model training workflow focuses on robustness rather than single-point accuracy
The input to Attn-LSTM is a fixed-length historical window, and the output is the temperature increment at the next time step. During training, the system uses Huber loss to reduce the impact of outliers, together with the Adam optimizer, cosine annealing learning rate scheduling, and early stopping to improve convergence stability.
At the same time, the system retains standard LSTM and Persistence baseline models. This design is critical because, in time series tasks, a more complex model does not always outperform a simpler one. By comparing models under a unified evaluation framework, developers can determine whether the attention module truly delivers value instead of being misled by architectural complexity.
import torch
import torch.nn as nn

class AttnLSTM(nn.Module):
    def __init__(self, input_size, hidden_size):
        super().__init__()
        self.lstm = nn.LSTM(input_size, hidden_size, batch_first=True)
        self.attn = nn.Linear(hidden_size, 1)
        self.fc = nn.Linear(hidden_size, 1)

    def forward(self, x):
        out, _ = self.lstm(x)                       # Extract hidden states from the sequence
        score = torch.softmax(self.attn(out), 1)   # Compute attention weights for each time step
        context = (out * score).sum(dim=1)         # Aggregate the context vector with weighted sum
        pred = self.fc(context)                    # Output the next-step prediction
        return pred, score
This code summarizes the core idea of Attn-LSTM: first encode the sequence, then apply weighted aggregation over the most important time steps.
The evaluation framework covers error, goodness of fit, and interpretability
The project uses MAE, RMSE, R², and MASE for evaluation. MAE reflects average absolute error, RMSE is more sensitive to large errors, R² measures goodness of fit, and MASE makes it easier to compare against a naive forecasting baseline. This multi-metric combination is more suitable for engineering decisions than relying on RMSE alone.
The original experimental results show that, under the current dataset and parameter configuration, standard LSTM performs slightly better than Attn-LSTM, while Attn-LSTM also does not show a significant advantage over the Persistence baseline. This result indicates that the value of attention depends on dataset size, feature quality, and hyperparameter choices, rather than the model name itself.
The visualization layer closes the last mile of model delivery
The system provides not only forecast outputs, but also training curves, test-set prediction curves, error trend charts, and attention heatmaps. For business users or educational settings, this type of visualization is a core part of model usability rather than an optional add-on.
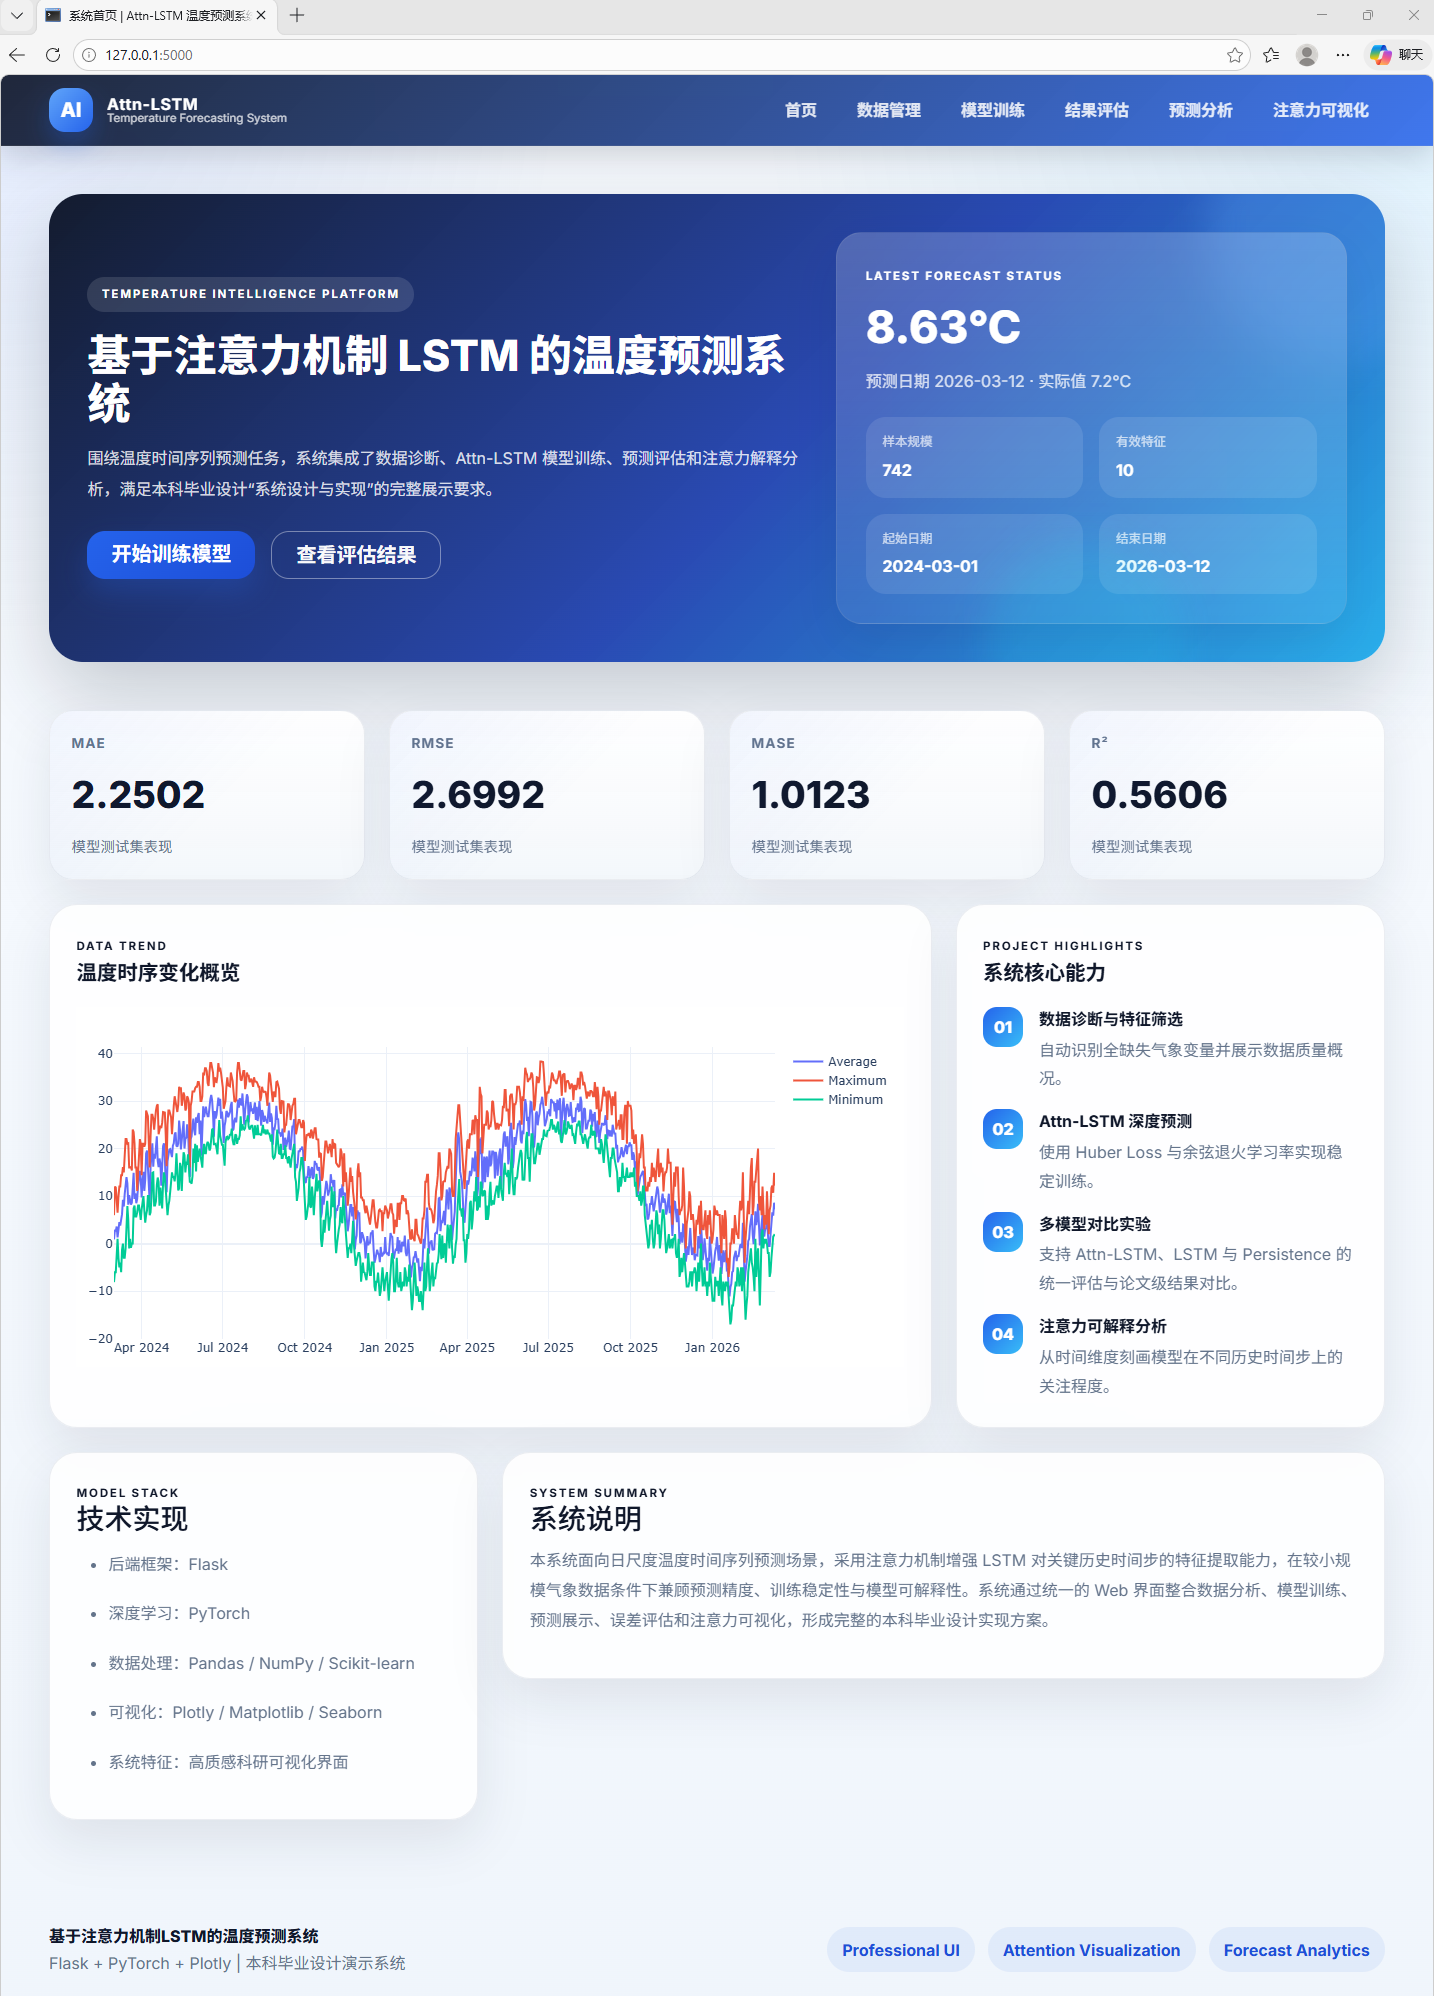
AI Visual Insight: This image shows the system homepage, which serves as the unified entry point for the temperature forecasting platform. It typically includes data import, training triggers, result browsing, and module navigation areas, showing that the project is not just an algorithm script but a usable web application.
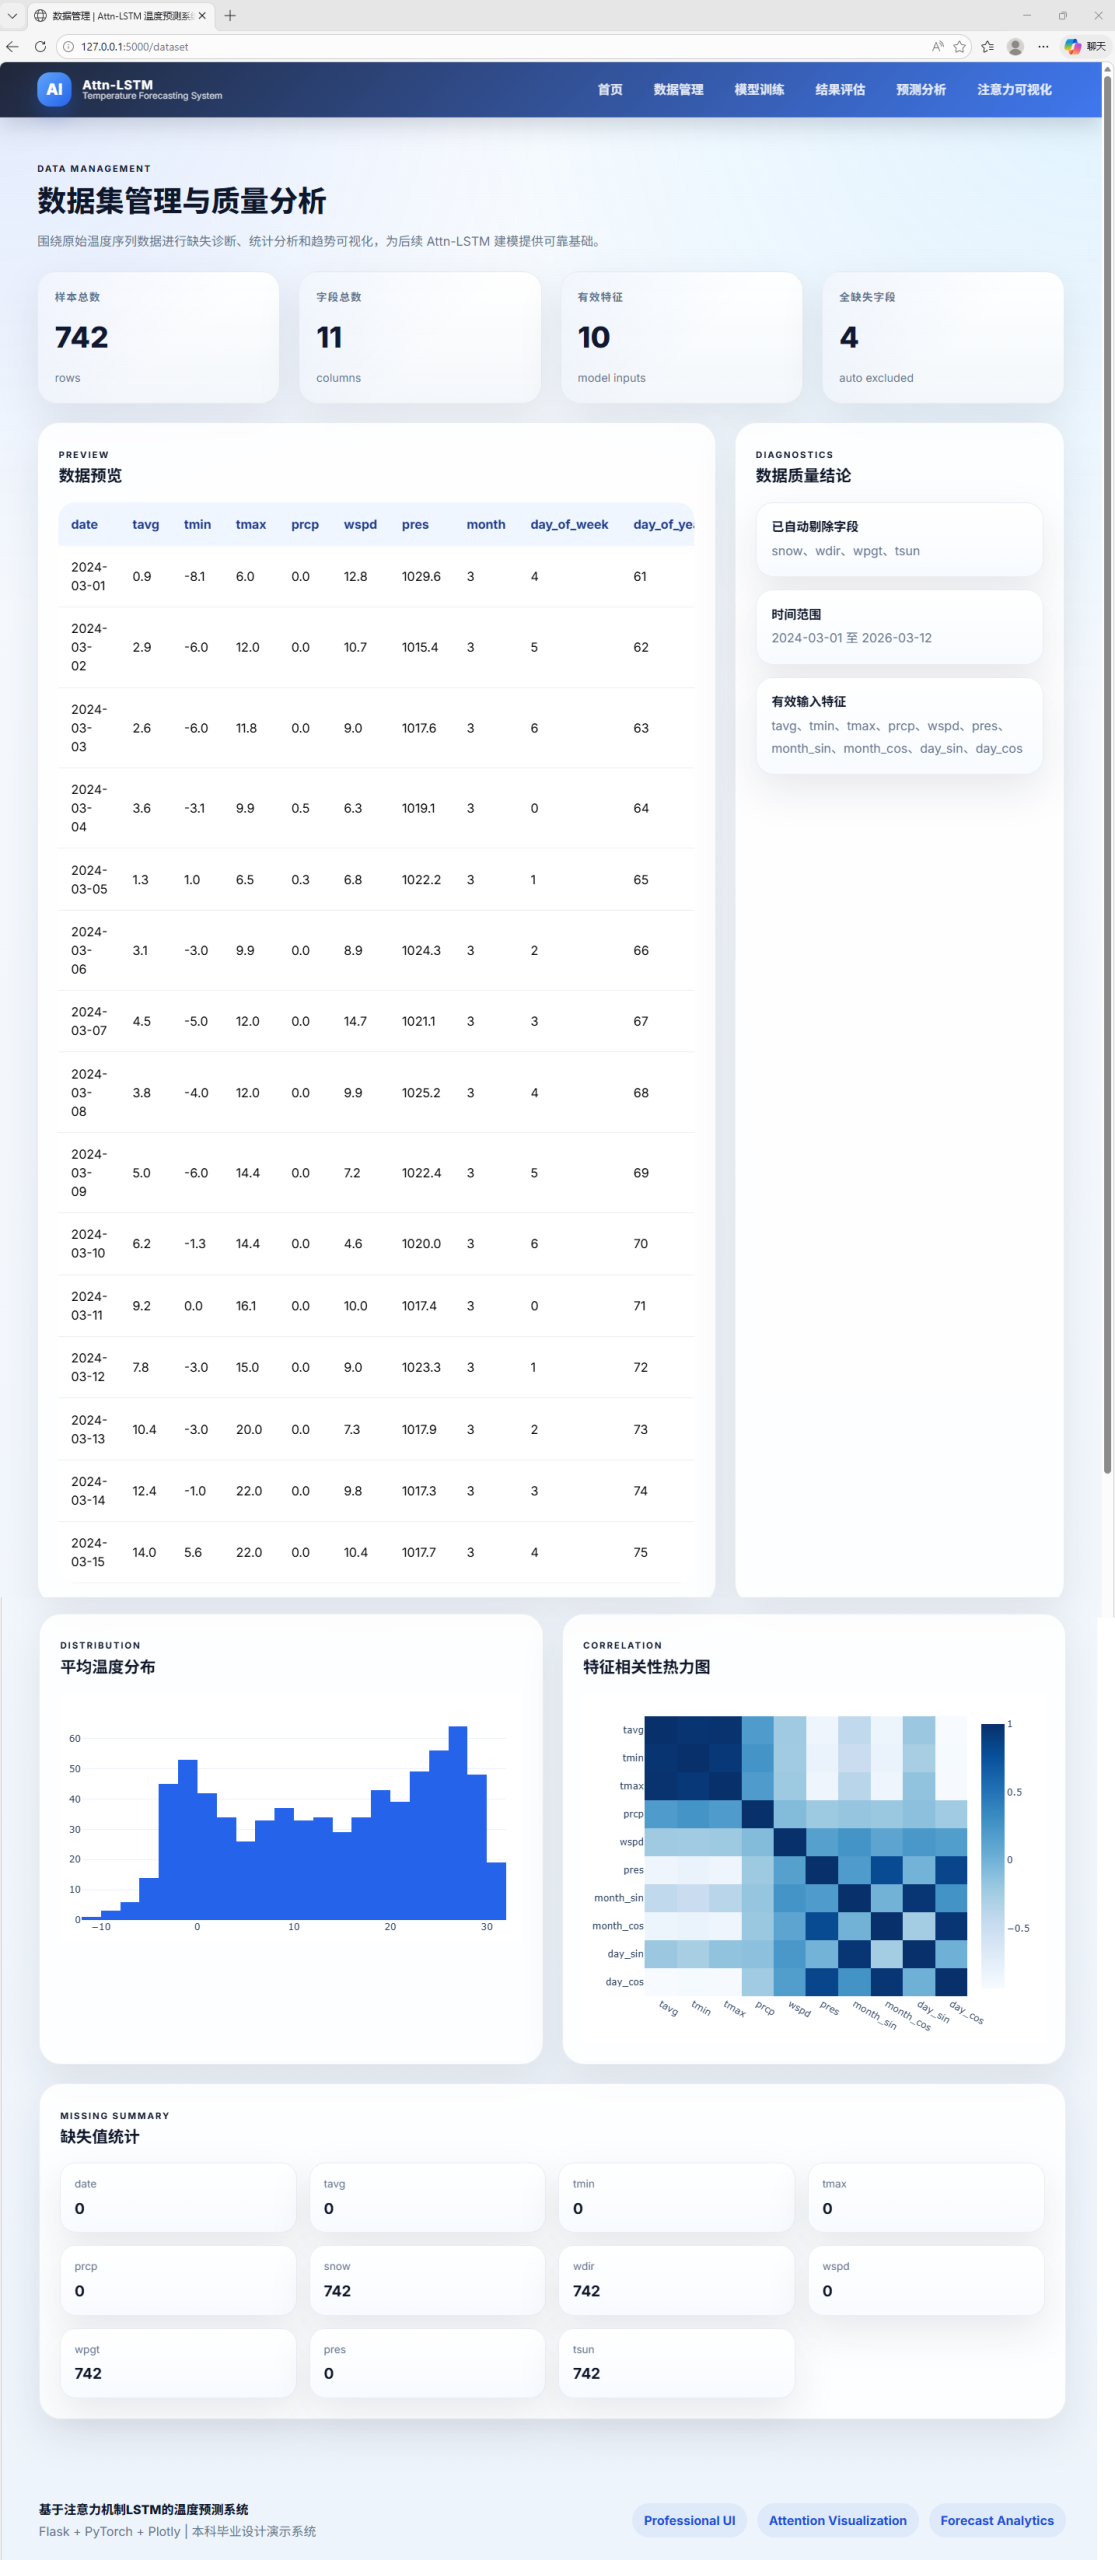
AI Visual Insight: This image shows the dataset management and quality analysis page. The interface typically presents field distributions, missing value status, sample size, and time continuity checks, indicating that the system moves data governance ahead of modeling.
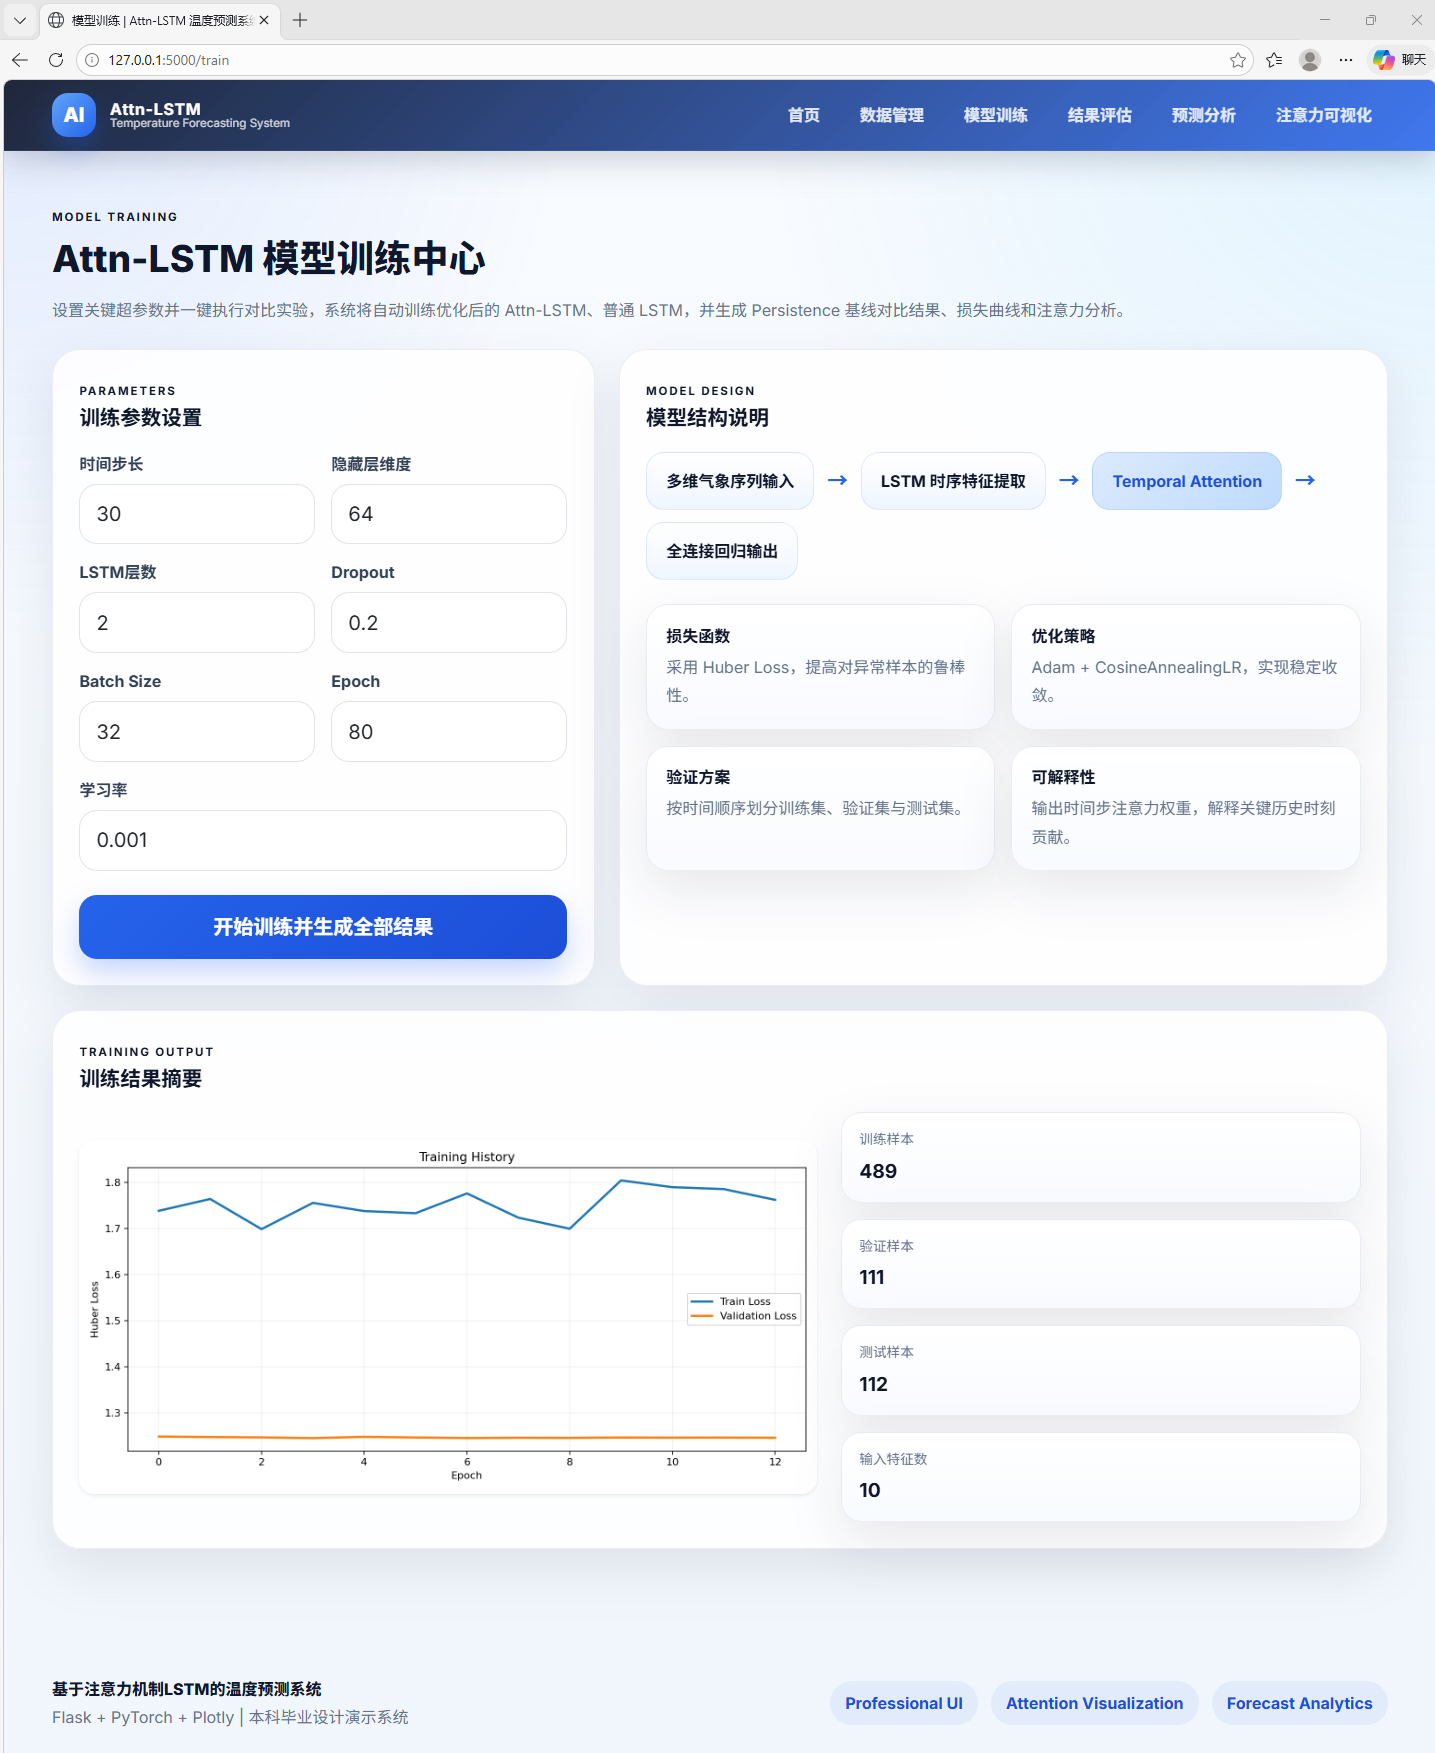
AI Visual Insight: This image shows the model training page. Key elements should include hyperparameter settings, training epochs, loss trends, and status feedback, reflecting that the system supports a complete interaction loop from experiment configuration to training execution.
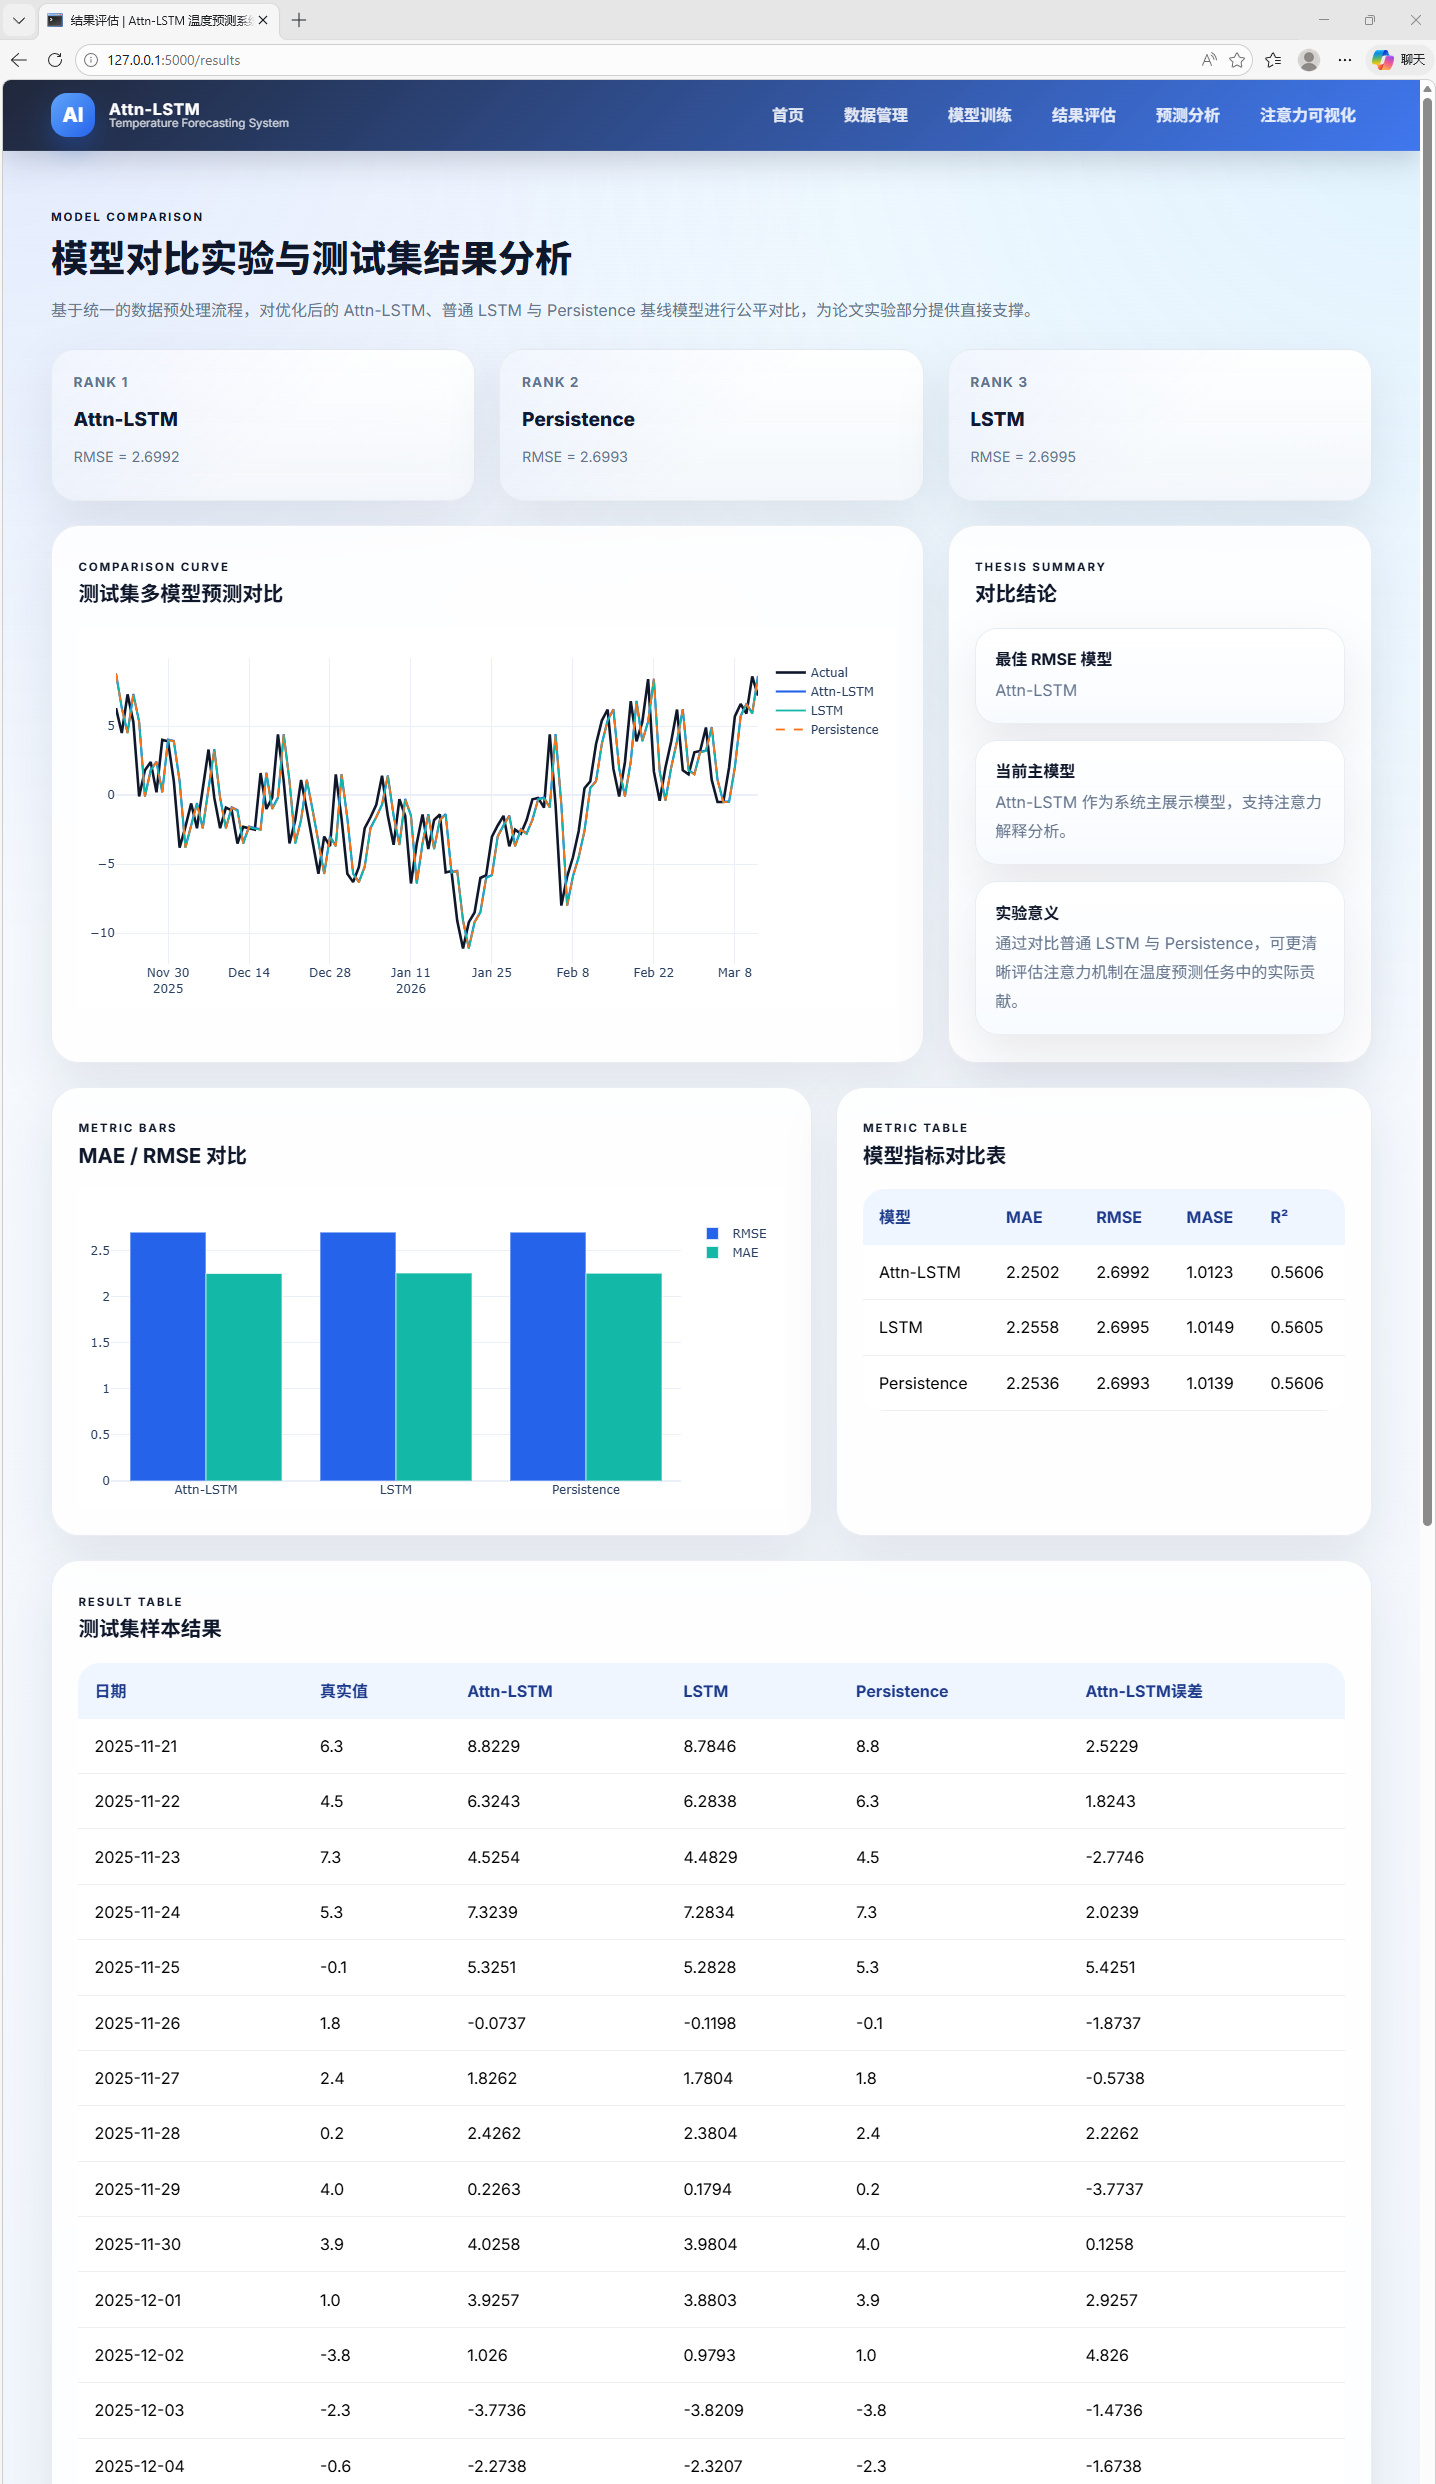
AI Visual Insight: This image shows the results evaluation page. It typically presents metrics such as MAE, RMSE, R², and MASE, along with model comparison results, helping developers quickly assess the strengths and weaknesses of Attn-LSTM, LSTM, and baseline methods.
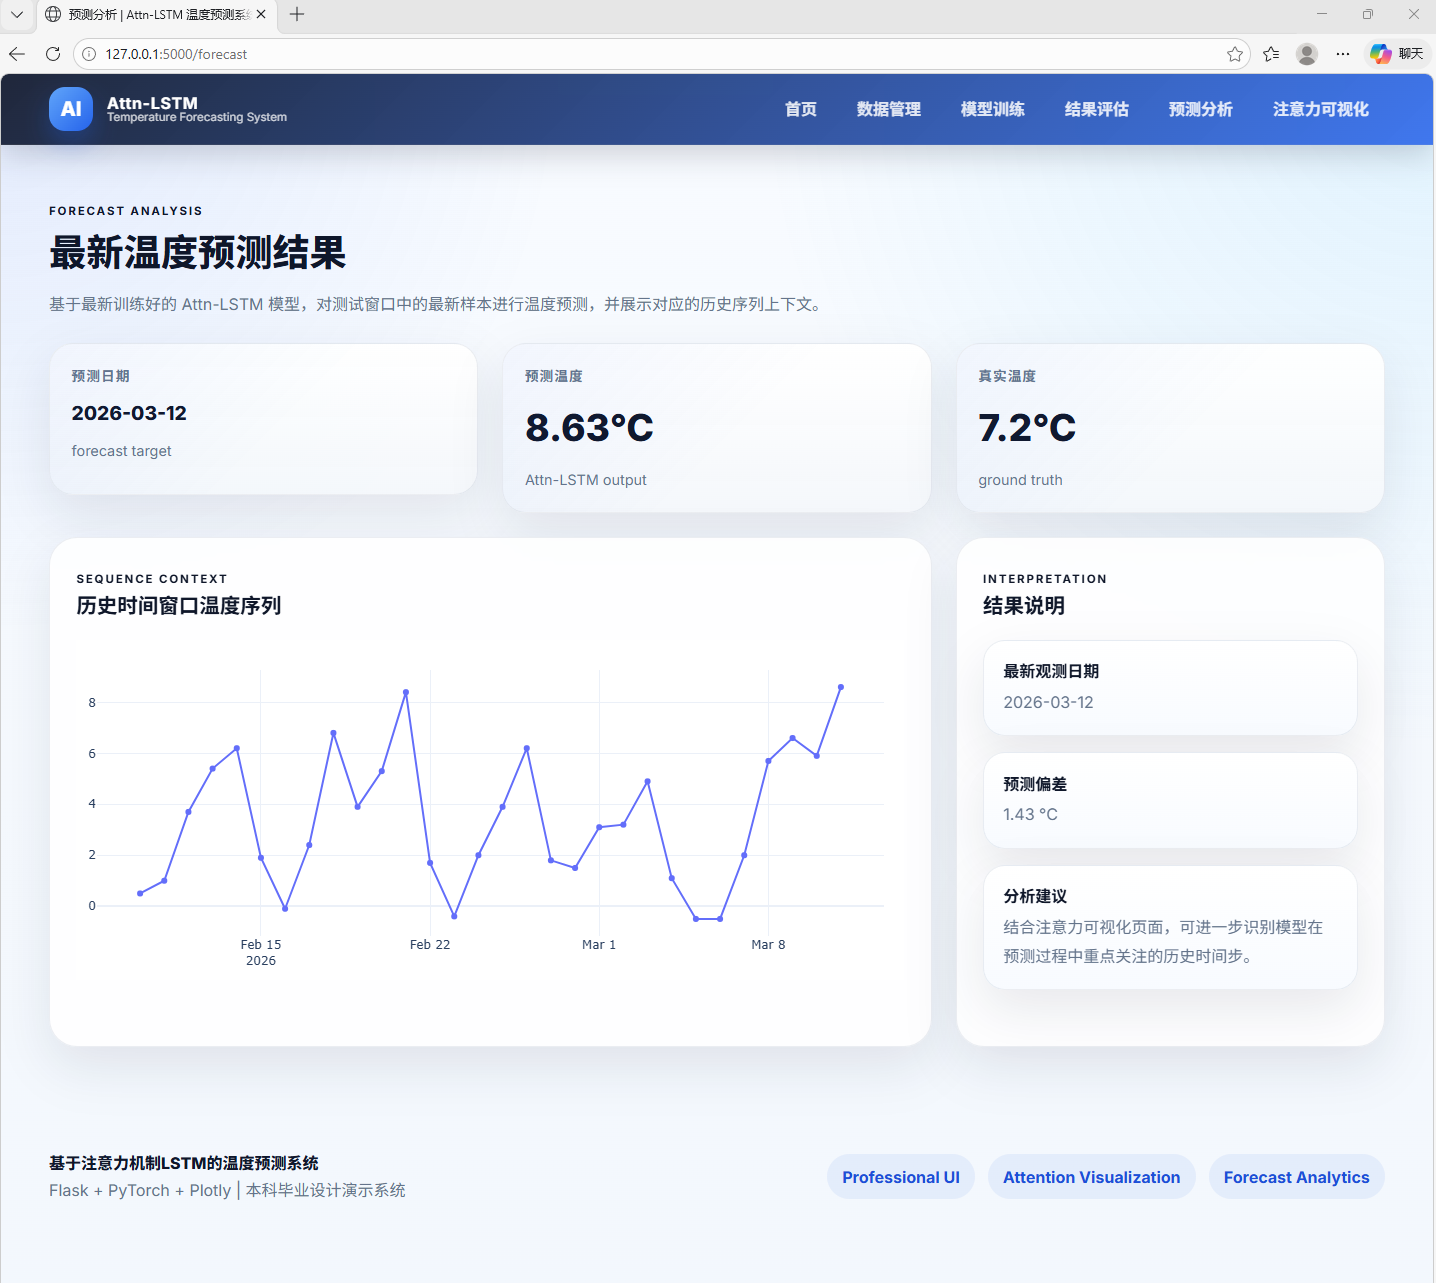
AI Visual Insight: This image shows the forecast analysis page. Its core content should be the overlaid comparison of actual and predicted temperature curves, along with local error intervals, from which you can observe how well the model fits trends, fluctuations, and turning points.
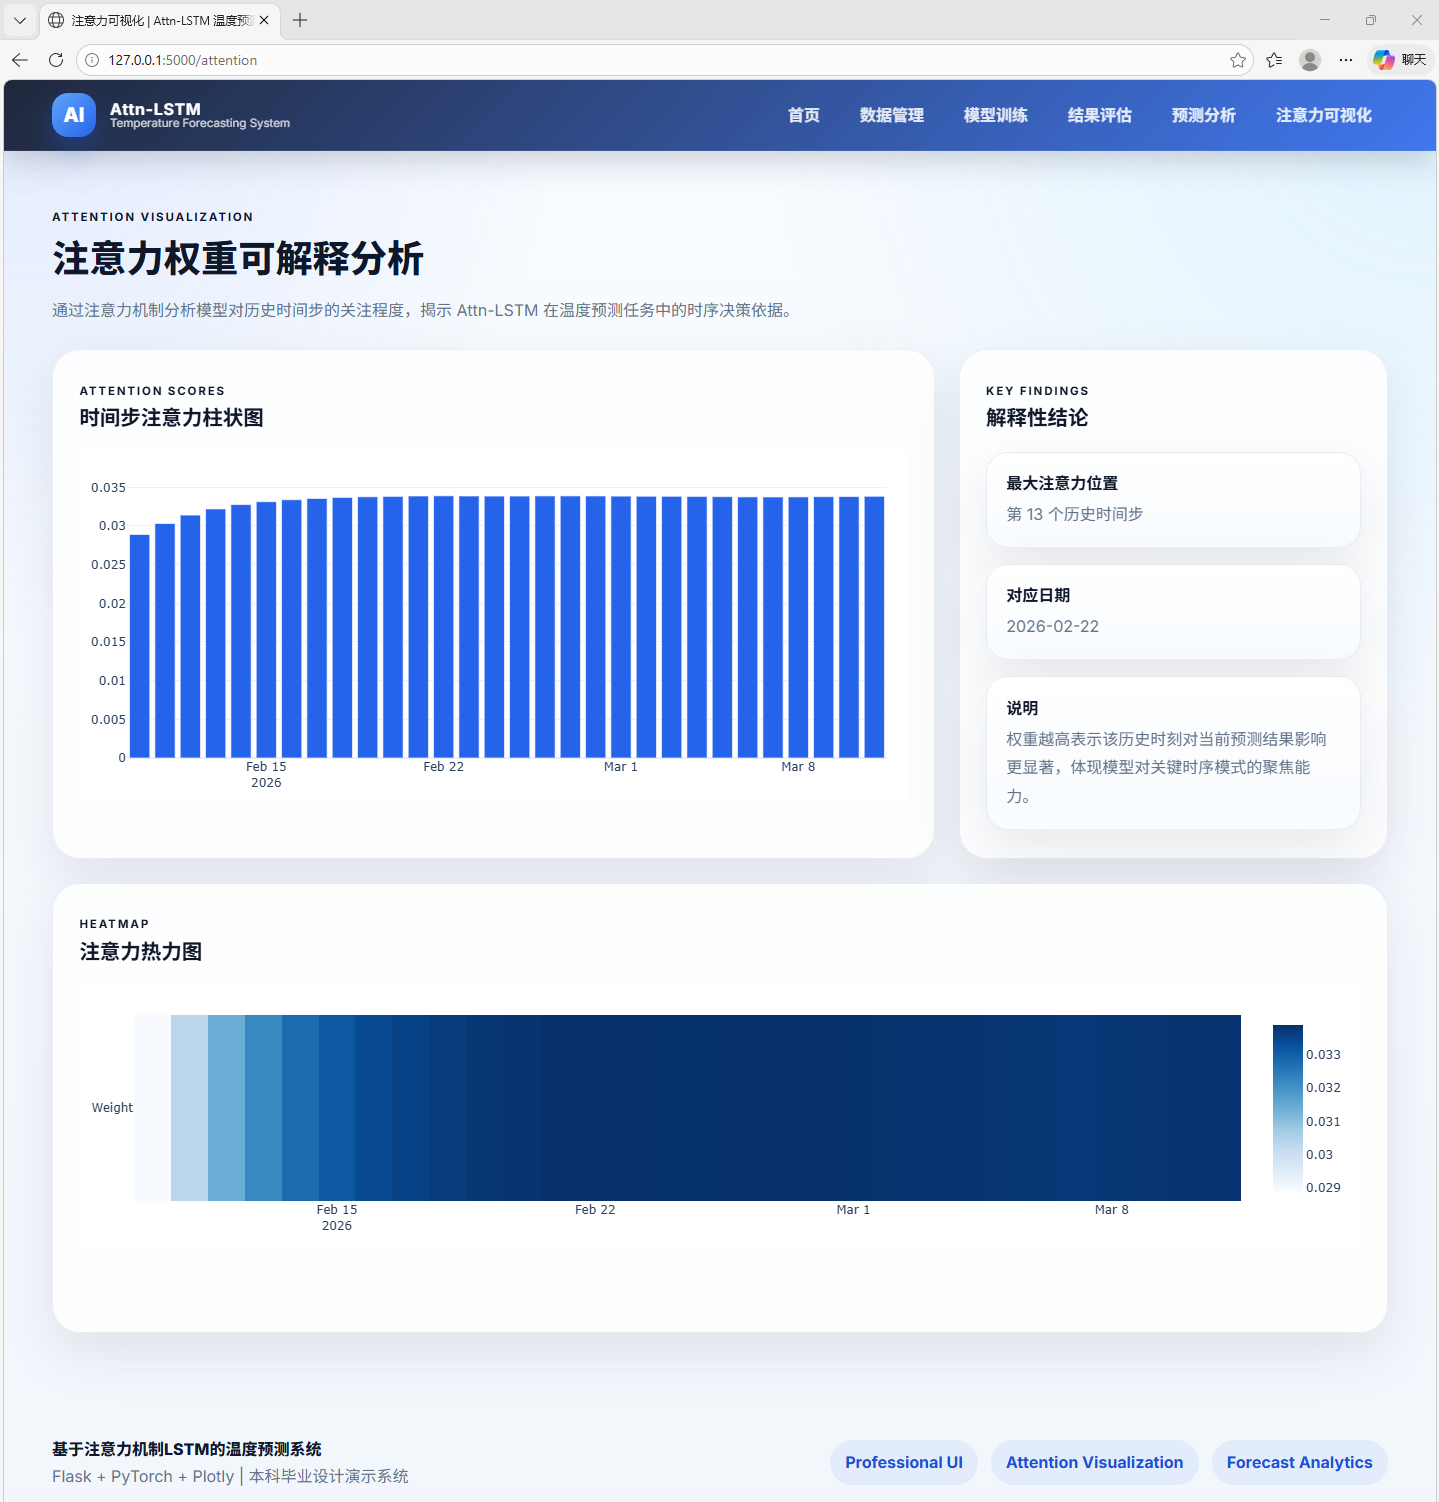
AI Visual Insight: This image shows the attention visualization results. It typically uses a heatmap or weighted bands to represent the importance distribution of historical time steps, helping analyze whether the model truly focuses on critical periods and improving the interpretability of the time series model.
The quick-start workflow is simple while still preserving a complete engineering loop
The deployment barrier is low. After installing the dependencies, run python app.py, then visit http://127.0.0.1:5000 to experience the full workflow. For teaching demos, small research projects, or prototype validation, this startup flow is highly efficient.
pip install flask torch pandas numpy scikit-learn matplotlib seaborn plotly
python app.py
These commands install the core dependencies and start the Flask-based temperature forecasting system.
This project works better as a time series engineering template than as a performance ceiling
Its value lies in connecting data processing, training, evaluation, and presentation into a complete system, while preserving model comparison experiments and interpretability outputs. Even though Attn-LSTM does not significantly outperform standard LSTM in the current setup, that result itself provides a credible baseline for future optimization.
To further improve performance, the priority recommendations are to expand the dataset, enrich holiday and weather-event features, optimize window length and hidden layer size, and experiment with multi-head attention, TCN-LSTM, or Transformer-style architectures. In practice, feature engineering usually produces more stable gains before a model upgrade does.
FAQ
Q: Why does Attn-LSTM not significantly outperform standard LSTM?
A: This is usually caused by insufficient dataset size, weak seasonal features, mismatched window length, or untuned attention parameters. An attention mechanism can improve representational capacity, but it does not guarantee better metrics on every temperature forecasting task.
Q: Why use temperature increments as the prediction target instead of predicting absolute temperature directly?
A: Predicting increments can reduce the effect of absolute-scale fluctuations in the sequence, allowing the model to focus more on change patterns and often improving training stability. The final real-world forecast can then be recovered by combining the prediction with the previous time step’s temperature.
Q: Can this system be extended to other time series tasks?
A: Yes. As long as you replace the input features and target column, this Flask + PyTorch + sliding-window + multi-metric evaluation framework can also be transferred to scenarios such as load forecasting, air quality forecasting, and sales forecasting.
Core Summary: This article reconstructs an Attn-LSTM system design for temperature time series forecasting, covering data preprocessing, cyclical feature construction, sliding-window modeling, PyTorch training, Flask-based visualization, and multi-metric evaluation, while analyzing the practical benefits and limitations of attention mechanisms in real-world temperature forecasting.