This article focuses on how to prepare for the 2026 Statistical Modeling Competition. It covers the contest requirements, four high-value topic directions, and four frequently used algorithm frameworks to address common pain points such as vague problem statements, model mismatch, and weak causal or interpretability analysis. Keywords: Statistical Modeling Competition, topic selection strategy, high-frequency algorithms.
Technical Specifications Snapshot
| Parameter | Details |
|---|---|
| Domain | Statistical modeling competitions, data analysis, machine learning |
| Core Languages | Python, R, SQL (optional), with no-code tools also available |
| Common Rules / Standards | Plagiarism rate ≤ 20%, main paper body ≤ 16,000 words |
| Competition Scale Reference | In 2025, approximately 885 institutions, 30,941 teams, and 92,823 students participated |
| Platform Popularity | The original source was a trending technical article on CSDN |
| Core Dependencies | SPSSAU, statistical yearbooks, public datasets, machine learning model libraries |
| Key Methods | DID, PSM, TOPSIS, ARIMA, XGBoost |
This Competition Ultimately Tests Problem Definition Skills
The theme of the 2026 National College Student Statistical Modeling Competition is “Serving National Strategies Through Innovative Statistical Empowerment.” That means high-scoring submissions do not depend on flashy techniques. They depend on how well the topic and method fit each other.
The hard constraints are clear: undergraduate and graduate divisions are separated, each team has three members, and cross-institution teams are not allowed. The main paper body must not exceed 16,000 words, and the plagiarism rate must stay below 20%. The rules are straightforward. What truly differentiates teams is whether the research question is specific, quantifiable, and interpretable.
Competition Milestones Require Advance Planning
Campus-level rounds are usually completed before mid-May, provincial rounds begin in mid-June, and the national round determines the final awards. A more reliable preparation schedule is to finalize the topic in April, complete data cleaning and baseline models in May, and polish the paper in June.
timeline = {
    "April": "Finalize the topic and data sources",  # Lock in the problem and available data first
    "May": "Complete modeling and robustness checks",  # Build core models and validate results
    "June": "Refine the paper and presentation materials"  # Align charts, conclusions, and policy recommendations
}
print(timeline)
This code expresses a minimum viable preparation timeline for the competition.
High-Scoring Topics Must Balance Strategic Relevance and Data Availability
The most valuable insight in the source material is not the popularity of the directions themselves, but the fact that each direction comes with a policy context, public data sources, and a clear entry point for modeling. High-scoring topics usually come from a narrow problem scope with strong interpretability.
Carbon Neutrality and Green Development Remain the Most Reliable Track
The carbon neutrality track combines strong policy relevance with rich data availability. It works well for carbon emission measurement, green efficiency evaluation, emissions reduction potential forecasting, and regional comparison. Common data sources include the National Bureau of Statistics, local statistical yearbooks, ecological and environmental bulletins, and remote sensing data.
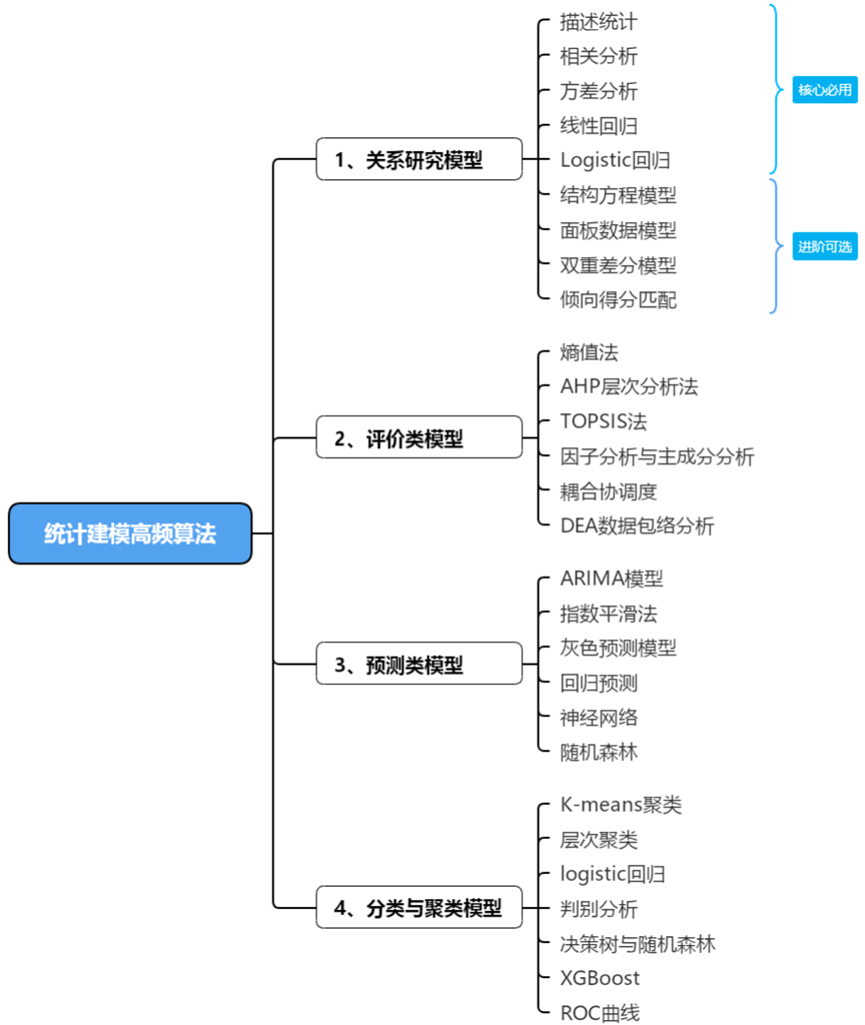 AI Visual Insight: The diagram uses a tree structure to organize common statistical modeling methods into four major categories: relationship analysis, evaluation, forecasting, and classification and clustering. It shows that competition modeling is not about a single algorithm, but about building a method matrix around the research problem.
The Digital Economy and New Quality Productive Forces Are the Hottest Policy Directions
This direction is suitable for digital economy measurement, industrial resilience, data factor allocation, and digital empowerment for rural revitalization. Its advantage is a strong policy narrative. Its challenge is that building the indicator system is difficult, so teams often need to combine evaluation models with regression models.
Public Welfare and Public Health Topics More Easily Produce Actionable Conclusions
Topics such as education equity, elderly care, medical resource allocation, and chronic disease risk identification usually have clearer sample definitions and make it easier to write practical policy recommendations. If your team is stronger in surveys, statistical inference, or medical data processing, this category is often a safer choice.
def choose_topic(policy_fit, data_access, interpretability):
    score = policy_fit * 0.4 + data_access * 0.3 + interpretability * 0.3  # Composite score
    return score
This code provides a simplified scoring logic for topic screening and can support fast internal team decisions.
Four High-Frequency Algorithm Categories Define the Structural Backbone of the Paper
The source article provides its greatest value by organizing frequently used competition methods into four categories: relationship analysis, evaluation, forecasting, and classification and clustering. This taxonomy directly maps to four common task types in competition papers.
Relationship Analysis Models Are Best for Answering “Why”
Descriptive statistics, correlation analysis, ANOVA, linear regression, and Logistic regression are the standard baseline toolkit. Structural equation models, panel models, DID, and PSM handle stronger causal identification tasks.
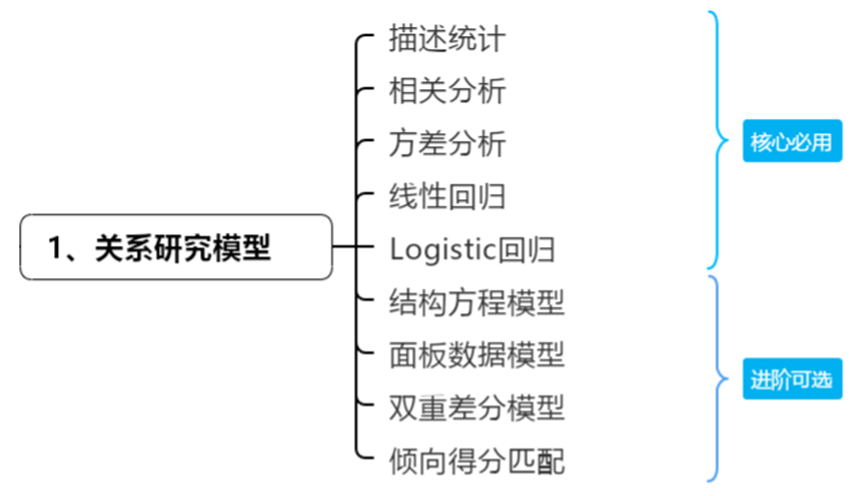 AI Visual Insight: The figure layers foundational statistical methods and advanced causal models to highlight the analytical path from variable associations and group differences to causal inference. This structure works well for the mechanism analysis and policy effect evaluation sections of a paper.
For policy evaluation topics, DID is almost always a frequent choice. If systematic differences exist between the treatment group and the control group, adding PSM can significantly improve persuasiveness.
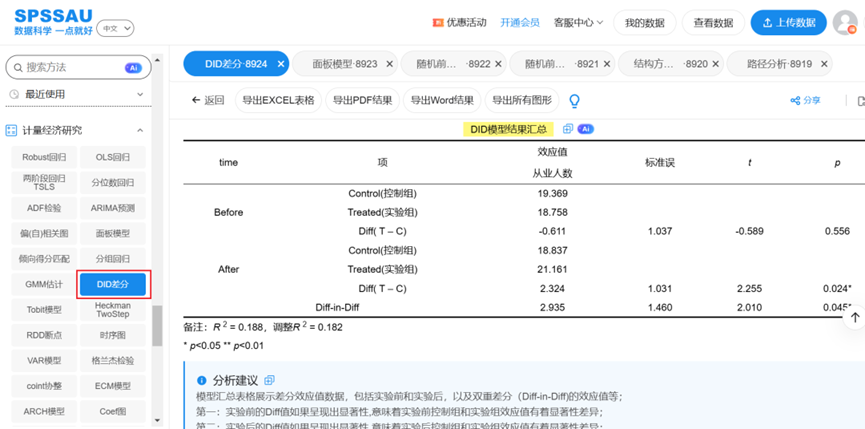 AI Visual Insight: The image shows typical difference-in-differences model output, usually including the interaction term coefficient, significance levels, and regression summary. Its core purpose is to identify the net effect of a policy on the treatment group relative to the control group before and after implementation.
Evaluation Models Are Best for Answering “Who Performs Better”
The entropy weight method, AHP, TOPSIS, principal component analysis, coupling coordination degree, and DEA are the most common tools for comprehensive evaluation tasks. If the problem requires building a regional development index, ranking urban competitiveness, or measuring resource allocation efficiency, these methods are usually essential.
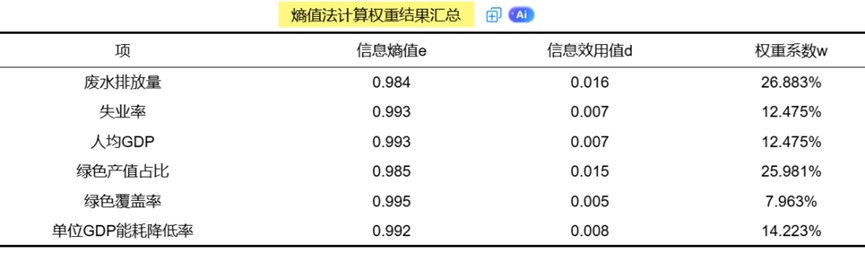 AI Visual Insight: The figure shows normalized indicator results, information entropy, and final weight distribution. It illustrates how the entropy weight method assigns weights automatically based on sample dispersion, which helps reduce subjective weighting bias.
Forecasting Models Are Best for Answering “What Will Happen Next”
ARIMA, exponential smoothing, and grey forecasting are suitable for time series forecasting. Regression, random forest, and neural networks are more suitable for multivariate prediction. If the dataset is small, prioritize grey forecasting. If the series is stable and long enough, ARIMA is usually the more standardized choice.
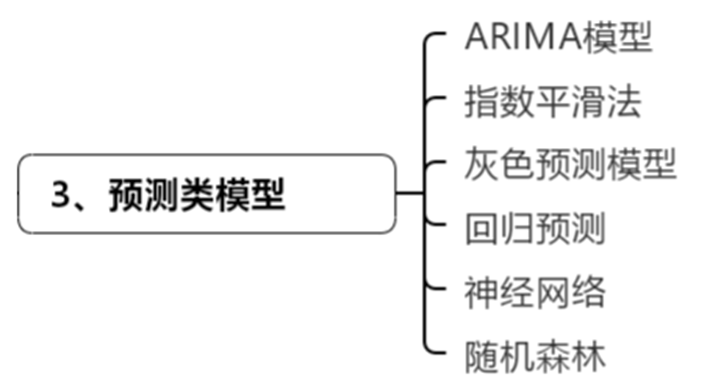 AI Visual Insight: The diagram summarizes both time series and machine learning forecasting methods, emphasizing the expansion path from traditional statistical forecasting to nonlinear models. It is well suited for the method selection explanation section of a paper.
from statsmodels.tsa.arima.model import ARIMA

model = ARIMA(series, order=(1, 1, 1))  # First-order autoregression + first differencing + first-order moving average
result = model.fit()  # Fit the time series model
forecast = result.forecast(steps=3)  # Forecast the next 3 periods
This code shows the basic ARIMA workflow and works well for a trend forecasting section.
Classification and Clustering Models Are Best for Answering “Which Category Does the Sample Belong To”
K-means and hierarchical clustering are used for unsupervised grouping. Logistic regression, discriminant analysis, decision trees, random forest, and XGBoost are used for supervised classification. If the goal is risk identification, user segmentation, or disease classification, XGBoost is often the first choice when predictive accuracy matters most.
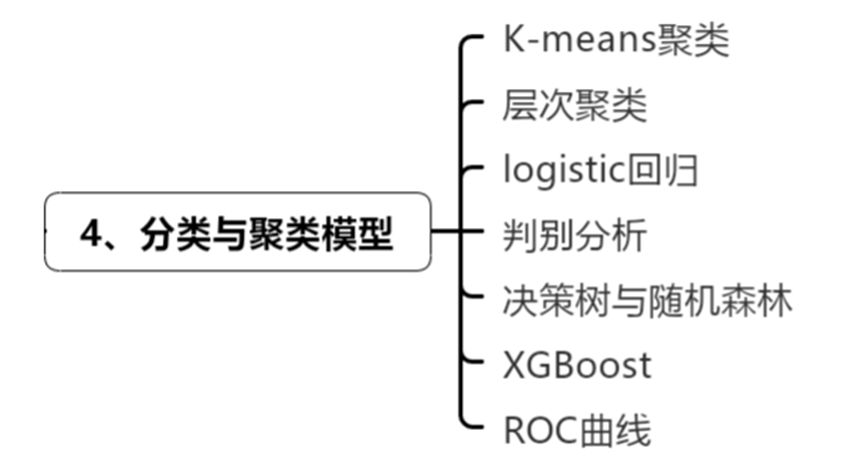 AI Visual Insight: The image uses classification trees and grouping structures as the central visual elements to present the parallel relationship between supervised and unsupervised learning. It helps explain the difference between recognition problems and segmentation problems in competition modeling.
The Real Purpose of Tool Selection Is to Reduce Implementation Cost
The source content repeatedly mentions SPSSAU, which reflects an important reality: in competitions, the tool barrier is itself a variable. For teams without programming backgrounds, no-code platforms can quickly support regression, panel models, DID, entropy weight analysis, and machine learning modeling.
However, from the perspective of paper quality, the tool itself is not the deciding factor. What matters is whether you can explain variable definitions, model assumptions, robustness, and the boundaries of your conclusions. Judges care more about the fit between method and problem than the name of the software.
A More Reliable Paper Structure
A strong default structure is: background and problem statement, indicator construction, model identification, robustness checks, and policy recommendations. Relationship models explain mechanisms, evaluation models rank performance, forecasting models project trends, and classification models identify groups. You do not need to use all four, but you do need a closed logical loop.
paper_structure = [
    "Research background and problem definition",  # Define the scope of the problem
    "Data sources and indicator system",  # Explain the sample and variables
    "Model construction and result analysis",  # Present the core findings
    "Robustness and heterogeneity checks",  # Improve credibility
    "Conclusions and policy recommendations"  # Return to the national strategy context
]
This code abstracts the common structure of a modeling paper into a reusable template.
FAQ
Should I choose the topic first or the algorithm first for a statistical modeling competition?
Choose the topic first. The algorithm serves the problem. Confirm policy value, data availability, and variable definitions before deciding whether to use regression, evaluation, or forecasting models.
Can I still produce a high-quality submission without a programming background?
Yes. The key lies in data cleaning, indicator design, model interpretation, and paper writing. Tools such as SPSSAU can lower the implementation barrier, but you still need to understand model assumptions and applicability.
What kinds of submissions are more likely to win awards?
The strongest submissions usually define a small but precise problem, maintain a complete data chain, align the model closely with the question, and translate findings into practical policy recommendations. Simply stacking complex algorithms is rarely enough.
Core Summary
This article reconstructs the core information for the 2026 Statistical Modeling Competition. It distills the competition rules, four high-scoring topic directions, and four frequently used algorithm categories—relationship analysis, evaluation, forecasting, and classification and clustering—to help participants quickly complete topic selection, model matching, and preparation planning.