This project uses Three.js to build an interactive 3D Earth satellite orbit visualization platform. Day 1 completes the core workflow: Earth scene construction, satellite rendering, orbit grouping, country/type filtering, and hover-click interactions. It addresses common challenges in front-end spatial visualization, including a steep 3D learning curve, cluttered orbit displays, and weak interaction feedback. Keywords: Three.js, satellite orbit visualization, front-end 3D interaction
Technical specifications are summarized below
| Parameter | Description |
|---|---|
| Development Language | HTML5, CSS3, JavaScript ES6+ |
| Core License | Original content is licensed under CC 4.0 BY-SA |
| Core Library | Three.js v0.160.0 |
| Interaction Controls | OrbitControls |
| Rendering Foundation | WebGL / requestAnimationFrame |
| Data Source | Day 1 uses mock satellite data |
| Repository Popularity | Star count was not provided in the original content |
| Key Dependencies | TextureLoader, Raycaster, Map |
This project is a front-end prototype for spatial visualization scenarios
The goal of this project is not just to draw an Earth model. It is to build a satellite orbit display system that is filterable, interactive, and extensible. By Day 1, the project has already completed the essential loop: scene setup, satellite rendering, orbit management, filter controls, and mouse interaction.
From a product perspective, it balances demo value with engineering extensibility. It works well for astronomy education, classroom demonstrations, aerospace showcases, and as a practical Three.js learning example. The current version uses a pure front-end architecture and can later integrate real orbit data APIs without major restructuring.
The project scope is clearly defined on Day 1
The core interaction model includes three actions: show only satellites by default, reveal the corresponding orbit on hover, and open a detail modal on click. The filter panel supports filtering by country/region and satellite type, which reduces cognitive load by preventing too many objects from appearing on screen at once.
The value of this design is that it upgrades the experience from “a 3D scene you can look at” to “data objects you can inspect, control, and explain.” For visualization systems, that matters more than pursuing flashy animation alone.
// Current filter state
const filterState = {
  country: 'all', // Country dimension: all/China/United States/Other
  type: 'all'     // Type dimension: all/Navigation/Communication/Meteorology/Remote Sensing
};
This code defines the state entry point for the visualization interface and serves as the foundation for controlling satellite visibility.
The system uses modular responsibilities to reduce Three.js project complexity
The original implementation can be divided into five modules: the 3D scene module, the satellite and orbit module, the filter control module, the interaction event module, and the UI presentation module. This separation is highly reasonable because rendering, data, events, and interface logic naturally belong to different responsibility domains.
The most important part is the satellite and orbit module. It not only creates objects, but also groups them by orbit parameters. This avoids creating duplicate geometry for the same orbit and directly reduces rendering overhead.
Scene initialization follows the standard Three.js workflow with practical engineering trade-offs
The scene uses a dark background to simulate outer space. The camera is a perspective camera. The renderer enables anti-aliasing and an alpha channel. OrbitControls manages navigation and constrains the minimum and maximum zoom distance so users cannot enter unreasonable viewpoints.
// Create the scene, camera, and renderer
const scene = new THREE.Scene();
scene.background = new THREE.Color(0x050510); // Space background color

const camera = new THREE.PerspectiveCamera(
  45, // Field of view
  window.innerWidth / window.innerHeight,
  1,
  10000
);
camera.position.set(450, 225, 450); // Initial viewing position

const renderer = new THREE.WebGLRenderer({
  antialias: true, // Enable anti-aliasing
  alpha: true      // Support transparent background
});
renderer.setSize(window.innerWidth, window.innerHeight);
renderer.setPixelRatio(Math.min(window.devicePixelRatio, 2)); // Control high-DPI rendering cost
This code initializes the 3D runtime environment and serves as the starting point for the entire rendering pipeline.
Lighting and background design prioritize readability, not just aesthetics
The project combines ambient light with directional light. Ambient light keeps shadowed surfaces visible, while directional light simulates sunlight and strengthens the spatial depth of the Earth and satellites. The starfield background is generated with random points, which keeps implementation cost low while delivering strong visual value.
Texture loading also includes a fallback strategy. If the Earth texture fails to load from the CDN, the system dynamically generates a replacement texture using Canvas. This is a practical resilience pattern for front-end 3D applications because it prevents the entire screen from failing when an external resource is unavailable.
Grouping and state synchronization are the keys to satellite and orbit rendering
Day 1 uses mock data with fields such as name, country, type, orbital altitude, orbital inclination, speed, and descriptive metadata. The data structure is already sufficient to support rendering, filtering, and detail display.
More importantly, orbits are not created one satellite at a time. They are grouped by combinations of radius and inclination. Satellites on the same orbit share the same orbit model. This design improves performance while keeping interactions manageable.
// Group by orbit parameters to avoid creating duplicate orbit objects
const orbitMap = new Map();
SATELLITES_DATA.forEach((satData) => {
  const key = `${satData.radius}_${satData.inclination}`; // Unique orbit key
  if (!orbitMap.has(key)) {
    orbitMap.set(key, {
      radius: satData.radius,
      inclination: satData.inclination,
      satellites: []
    });
  }
  orbitMap.get(key).satellites.push(satData); // Add to the same orbit group
});
This code builds an orbit index that supports geometry reuse and hover-driven interaction in later stages.
The satellite model and color system are responsible for information encoding
The project colors satellites using two dimensions: country and type. China, the United States, and other countries each map to different primary colors. Navigation, communication, meteorology, and remote sensing provide an additional functional layer for identification.
Although this encoding strategy is simple, it is highly effective for an early-stage product. In dense scenes, users first rely on color perception for rough classification, then use hover and detail modals to access precise information.
Filtering and mouse interaction define the user’s exploration path
The filter panel handles global control, while Raycaster supports local exploration. Combined together, they let users narrow the scope first and then inspect individual objects. This interaction flow aligns well with how users typically explore visualization systems.
When the user hovers over a satellite, the system reveals only its corresponding orbit and hides other satellites on that orbit. This is a smart strategy. It solves the classic problem where objects still feel crowded even after showing an orbit, and it turns the current target into the visual focus.
// Typical animation loop: update controls, Earth rotation, and satellite motion
function animate() {
  requestAnimationFrame(animate);
  controls.update(); // Update damping-based controls
  earth.rotation.y += 0.001; // Slowly rotate the Earth

  satellites.forEach((sat) => {
    sat.angle += sat.speed; // Advance orbital angle based on speed
    sat.mesh.position.set(
      Math.cos(sat.angle) * sat.radius,
      0,
      Math.sin(sat.angle) * sat.radius
    );
  });

  renderer.render(scene, camera); // Render the current frame
}
This code continuously updates the Earth and satellites and acts as the core loop behind the project’s dynamic behavior.
The current results already validate the feasibility of the product prototype
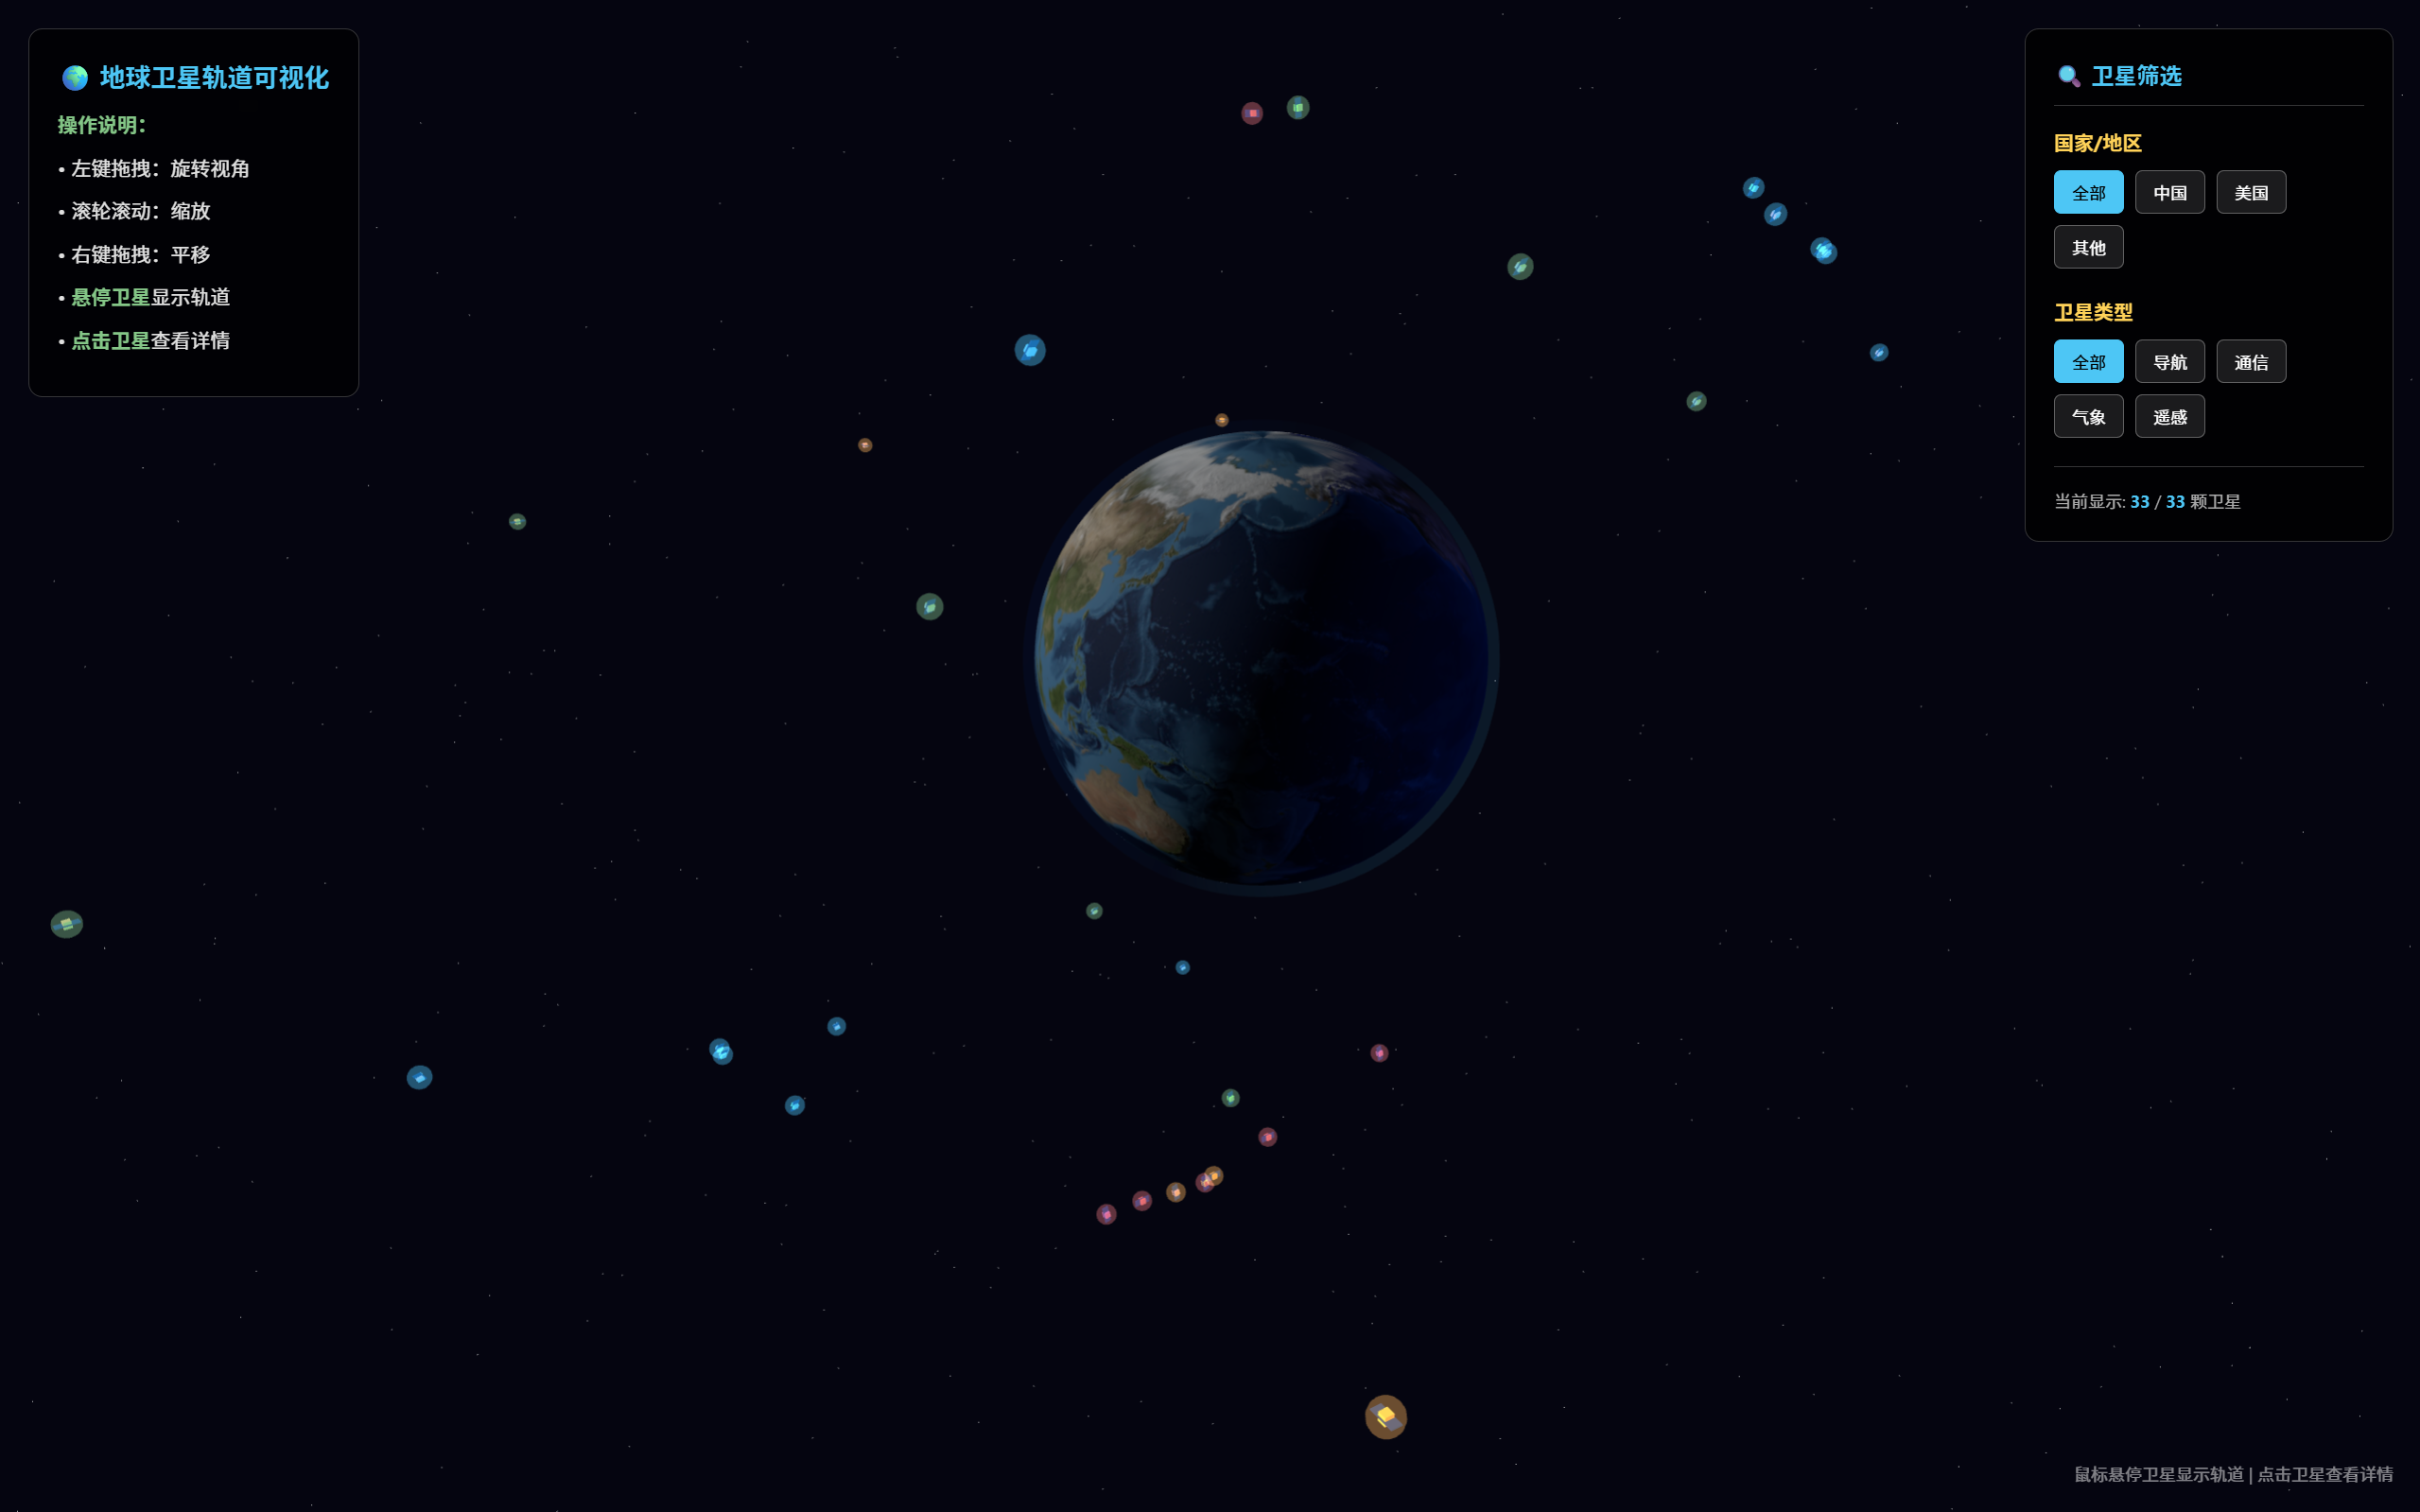 AI Visual Insight: This image shows a 3D Earth scene against a dark space background. A filter panel for country and satellite type appears on the right, while the left side contains operation hints. Multiple satellites are distributed around the Earth in different colors, indicating that the system has already completed spatial object placement, categorical color encoding, and coordinated UI layout. In other words, it already demonstrates the essential shape of an interactive orbit visualization product.
From the result, Day 1 is no longer just “something that runs.” It already shows completeness across presentation, filtering, interaction, and extensibility. That means the next phase can shift toward real data integration, orbit physics refinement, and performance optimization.
The next stage of evolution is already clear
First, integrate real data sources such as TLE feeds or NASA-related datasets to replace the mock data. Second, optimize orbital physics and scale relationships so the visuals are not merely convincing, but also physically meaningful. Third, introduce a modular file structure to further separate configuration, rendering, data, and interaction code.
If the project continues to expand, prioritize instanced rendering, object pooling, on-demand updates, and mobile adaptation. These capabilities will directly determine whether the project can evolve from a demo into a maintainable front-end visualization application.
FAQ
Q1: Why choose Three.js for this project instead of Cesium?
Three.js is lighter and better suited for building custom 3D interactive scenes from scratch. It also has a smoother learning curve. Since this project currently focuses on front-end interaction prototyping and visual expression, Three.js provides more flexibility. If the project later requires high-precision geographic coordinate systems, time-based orbital simulation, and large-scale Earth data processing, then Cesium becomes worth reevaluating.
Q2: Why does Day 1 use mock satellite data?
Because the core objective of the prototype phase is to validate the rendering, filtering, interaction, and UI workflow first. Mock data offers stable fields and lower debugging cost, which makes it easier to verify whether the architecture is sound. Once the data model and rendering pipeline are stable, integrating real TLE data becomes much safer.
Q3: What should this project prioritize for future optimization?
The top three priorities are real orbit data integration, orbit-to-satellite scale calibration, and rendering performance optimization. These three areas determine the system’s credibility, the accuracy of its spatial representation, and the number of objects it can handle. They are the key steps required to move from a demo to a practical application.
[AI Readability Summary]
This article reconstructs the Day 1 implementation of a Three.js-based 3D Earth satellite orbit visualization project. It covers scene initialization, satellite and orbit rendering, the filter panel, hover highlighting, and the detail modal, while also outlining the tech stack, module boundaries, performance trade-offs, and future evolution paths.