[AI Readability Summary]
Elasticsearch now supports Prometheus Remote Write as a native ingestion endpoint. It can receive Snappy-compressed Protobuf metric streams directly and write them into TSDS data streams without an intermediate adapter layer. The key benefits are lower integration complexity, preservation of the Prometheus label model, and support for PromQL and ES|QL queries. Keywords: Remote Write, TSDS, Prometheus.
The technical specification snapshot captures the core implementation details
| Parameter |
Description |
| Language |
Java (Elasticsearch server-side implementation) |
| Protocol |
HTTP POST + application/x-protobuf + Snappy |
| GitHub stars |
Not provided in the source article; the Elasticsearch GitHub repository is typically a highly active project |
| Core dependencies |
Protobuf, Snappy, Bulk API, TSDS, Dynamic Templates |
Elasticsearch has turned Prometheus Remote Write into a native ingestion entry point
Prometheus Remote Write traditionally depended on adapters, relay gateways, or dedicated time-series backends. Elasticsearch now exposes a native write endpoint, so Prometheus or Grafana Alloy can push metrics directly into Elasticsearch.
This solves two common problems. First, it removes intermediate components from the ingestion path and reduces maintenance overhead. Second, it brings metrics, logs, and traces into the same analytics plane, which simplifies unified querying, access control, and lifecycle management.
The request entry point starts at HTTP rather than at indexing
A Remote Write request enters the cluster as an application/x-protobuf HTTP POST request. Elasticsearch does not parse it immediately. Instead, it first applies the same indexing pressure controls used by the Bulk API. If the cluster is under heavy write pressure, Elasticsearch can reject the request early with 429.
The server then performs streaming decompression for the Snappy-compressed payload instead of expanding the entire payload into a large in-memory buffer at once. This reduces peak memory usage and also makes it possible to enforce a maximum decompressed size to protect against decompression bomb attacks.
curl -X POST "$ES/_prometheus/api/v1/write" \
  -H "Content-Type: application/x-protobuf" \
  -H "Content-Encoding: snappy" \
  --data-binary @remote-write.pb
This request shows the exact Remote Write entry format: HTTP, Protobuf, and Snappy are all required.
After Protobuf parsing, the payload expands into time series and samples
After decompression, Elasticsearch deserializes the request body into a WriteRequest. That object contains multiple TimeSeries entries, and each time series consists of a set of labels and multiple samples. A core Prometheus fact is that values are fundamentally float64, while the metric name is expressed through the __name__ label.
This means Elasticsearch cannot determine whether a metric is a counter or a gauge purely from the numeric type at the ingestion layer. The system must infer type semantics later or override them through templates.
Every sample is converted into an independent document
Elasticsearch uses a very direct processing model: every sample in every time series becomes one indexed document. Each document contains at least three parts: @timestamp, labels.*, and metrics.*.
{
  "@timestamp": "2026-04-01T12:00:00.000Z",
  "data_stream": {
    "type": "metrics",
    "dataset": "generic.prometheus",
    "namespace": "default"
  },
  "labels": {
    "__name__": "http_requests_total",
    "job": "prometheus",
    "instance": "localhost:9090",
    "method": "GET",
    "status": "200"
  },
  "metrics": {
    "http_requests_total": 1027.0
  }
}
This document shows the standard mapping from a sample to an Elasticsearch document: labels go into labels, and numeric values go into the metrics field named after the metric.
Labels and metrics are explicitly separated to avoid field conflicts
All labels, including __name__, go into labels.*. The actual numeric value is written to `metrics.
`. This design prevents conflicts between labels and metrics that share the same name, and it also allows TSDS to recognize labels automatically as dimension fields.
If a time series is missing `__name__`, Elasticsearch drops that series immediately and counts it as a failure. If a value is `NaN`, `Infinity`, or `-Infinity`, Elasticsearch skips it silently. This also includes the special NaN value that Prometheus uses as a staleness marker.
### The one-sample-per-document design relies on TSDS optimizations
At first glance, storing every sample as its own document may seem expensive, especially in high-cardinality label scenarios. Elastic’s position is that as TSDB and TSDS storage optimizations have matured, the additional cost of this design has dropped significantly.
As a result, compared with packing multiple metrics into a single timestamped document, the one-sample-per-document model provides a simpler write path, clearer mapping behavior, and more stable query semantics.
## Metric types come from naming inference rather than from the protocol
Remote Write v1 does not reliably send metric types together with samples. Metadata is usually sent separately, and in a distributed system it may not even arrive at the same node. As a result, Elasticsearch follows common industry naming conventions and infers metric types from suffixes.
Metrics ending in `_total`, `_sum`, `_count`, or `_bucket` are inferred as counters. Everything else defaults to a gauge. This is a practical design, but it is not a perfectly accurate semantic model.
“`text
http_requests_total -> counter
request_duration_seconds_sum -> counter
request_duration_seconds_count -> counter
process_resident_memory_bytes -> gauge
go_goroutines -> gauge
“`
These rules determine whether some ES|QL functions can be applied directly. For example, `rate()` depends more heavily on counter semantics.
### You can override the default inference rules with dynamic templates
If your naming conventions do not follow standard Prometheus suffix patterns, you can override field mappings with a component template. For example, you can explicitly define `metrics.*_counter` as a counter.
“`json
PUT /_component_template/metrics-prometheus@custom
{
“template”: {
“mappings”: {
“dynamic_templates”: [
{
“counter”: {
“path_match”: “metrics.*_counter”,
“mapping”: {
“type”: “double”,
“time_series_metric”: “counter”
}
}
}
]
}
}
}
“`
This template layers on top of the built-in default template and only overrides the field patterns you specify explicitly.
## The built-in index template is already prepared for TSDS and passthrough fields
Elasticsearch installs a built-in index template for `metrics-*.prometheus-*`. The template enables TSDS mode, which provides time-based partitioning, storage optimization, deduplication, and future downsampling support.
One important implementation detail is that both `labels` and `metrics` use `passthrough` objects. This not only isolates namespaces, but also makes `labels.*` automatically act as `time_series_dimension` fields and allows prefix omission during queries.
### The query experience is intentionally designed to feel close to the Prometheus mental model
In ES|QL or PromQL, you do not always need to write `labels.job` or `metrics.http_requests_total`. The query engine can transparently resolve `job` and `http_requests_total` to the correct paths. This makes Elasticsearch behave more like a Prometheus-compatible backend rather than a completely unfamiliar storage model.
At the same time, if the same metric name later appears with an incompatible mapping, failed documents are not dropped silently. They are routed into the failure store for troubleshooting and recovery analysis.
## Data stream routing enables write isolation by environment and team
The Remote Write endpoint supports three URL forms, each of which maps directly to a different data stream. The default path writes to `metrics-generic.prometheus-default`, while extended paths can include both dataset and namespace.
| URL pattern | Data stream |
|—|—|
| `/_prometheus/api/v1/write` | `metrics-generic.prometheus-default` |
| `/_prometheus/metrics/{dataset}/api/v1/write` | `metrics-{dataset}.prometheus-default` |
| `/_prometheus/metrics/{dataset}/{namespace}/api/v1/write` | `metrics-{dataset}.prometheus-{namespace}` |
### The routing design fundamentally serves retention, access control, and query performance
Production and development environments can write into different namespaces and therefore apply different retention policies. Different teams can also be restricted through API keys so they can write only to their own data streams, enabling finer-grained multi-tenant controls.
On the query side, Grafana or PromQL only needs to scan the relevant data streams instead of searching across all environments, which directly improves query latency and resource efficiency.
## Error handling strictly follows Remote Write retry semantics
The Remote Write specification separates errors into retryable and non-retryable classes. If Elasticsearch rejects a write because of indexing pressure, it returns `429`, which causes Prometheus to trigger exponential backoff retries.
If the result is partially successful and partially failed, the response includes the failed sample count and an aggregated error summary grouped by index and status code. A missing `__name__` usually maps to `400`. Non-finite values are silently discarded and still return success, so they do not trigger retries.
“`text
429 -> Retryable, usually caused by excessive indexing pressure
400 -> Non-retryable, usually caused by malformed data or a missing required label
NaN/Infinity -> Silently dropped and not retried
“`
This behavior aligns with the Prometheus sender retry model, so integrating Elasticsearch does not break existing write semantics.
## Remote Write v2 will further improve semantic completeness and compression efficiency
Version 2 is expected to send metric metadata together with samples, which removes the uncertainty of naming-based inference. It also supports native histograms, which can map naturally to Elasticsearch’s `exponential_histogram` field type.
In addition, dictionary encoding reduces payload size for high-cardinality labels, and creation timestamps make it easier to detect counter resets more accurately instead of relying only on the heuristic that a value decreased.
### Two important evolution paths are still worth watching
The first is support for staleness markers. Today, those special NaN values are discarded, so some PromQL lookback behaviors are still not fully equivalent. The second is a shared metric field design, which could reduce field explosion caused by generating one field per metric name.
Both directions point to the same goal: preserving Prometheus compatibility while continuing to improve Elasticsearch as a metrics backend in both storage efficiency and semantic precision.
## Availability now covers both Serverless and self-managed clusters
This capability is already available in Elasticsearch Serverless, and you can also validate it in self-managed environments through a local quick-start workflow. If you want to remove relay components from your observability stack while keeping Elasticsearch’s unified analytics capabilities, this approach offers strong practical value.
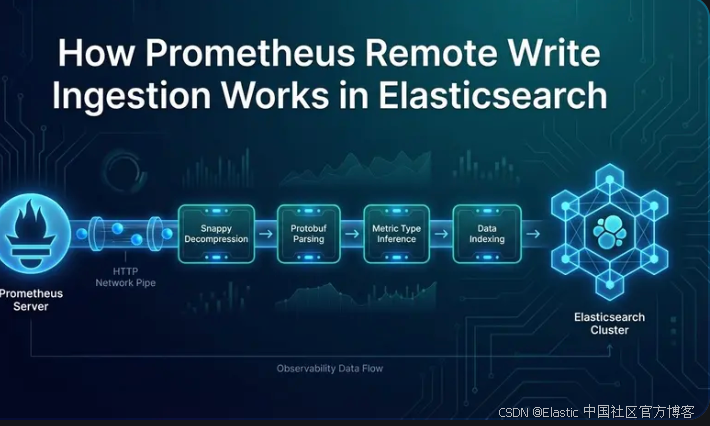
**AI Visual Insight:** This image serves as the article’s hero graphic. Its visual center highlights the integration between Prometheus Remote Write and Elasticsearch, emphasizing the architectural position of protocol-native ingestion, adapter-free integration, and a unified analytics backend for metrics.
## FAQ structured questions and answers
### Q: Why did Elasticsearch choose a one-sample-per-document model?
A: Because TSDS optimizations have significantly reduced the overhead of individual documents. Compared with packing multiple metrics together, this approach is simpler, produces more stable mappings, and improves error isolation and bulk write handling.
### Q: What happens if a metric type is inferred incorrectly?
A: The main impact appears in query functions that depend on counter semantics, such as `rate()` in ES|QL. You can explicitly override the default inference rules through custom component templates and dynamic templates.
### Q: Why are staleness markers not preserved today?
A: Because they are represented as a special NaN value, and the current implementation consistently skips non-finite values. This simplifies the write path, but it also means some PromQL lookback behavior differs from native Prometheus.
Core summary: This article systematically breaks down how Elasticsearch natively supports Prometheus Remote Write, covering HTTP ingress, Snappy decompression, Protobuf parsing, one-sample document conversion, TSDS mapping, metric type inference, data stream routing, and error handling, while also analyzing the evolution path of Remote Write v2.