This project uses Trae Solo and Tencent Location Services to complete flight trajectory data cleaning, JSON parsing, 3D route replay, and flight phase detection. It solves common problems in traditional tabular trajectory analysis, including poor readability, high development cost, and rigid animation. Keywords: Trae Solo, Tencent Location Services, flight trajectory visualization.
The technical specification snapshot defines the project baseline
| Parameter | Description |
|---|---|
| Primary languages | JavaScript, HTML |
| Map protocol/capabilities | Tencent Maps JavaScript API GL, GLTFModel, moveAlong |
| Data formats | Excel, JSON |
| Visualization targets | Flight trajectories, aircraft model, altitude profile, overview map |
| AI capabilities | Trae Solo data cleaning, trajectory parsing, phase detection |
| Core dependencies | Tencent Location Services, Trae Solo, Canvas |
| Project form | Front-end rendering + AI parsing + GIS support |
| Applicable scenarios | Civil aviation monitoring, route analysis, content creation, flight replay |
This project reconstructs the flight trajectory visualization pipeline with AI
Traditional flight trajectory presentation usually stops at tables, logs, or static polylines, which makes it difficult to express speed, altitude, heading, and phase transitions. This solution combines AI-driven data processing with GIS-based 3D rendering to build a complete loop from raw flight data to immersive replay.
The core value is not simply drawing points into lines. It is transforming discrete spatiotemporal data into a flight process that users can play back, follow, and interpret. This makes the system more useful for civil aviation operations, airspace analysis, and flight enthusiast review.
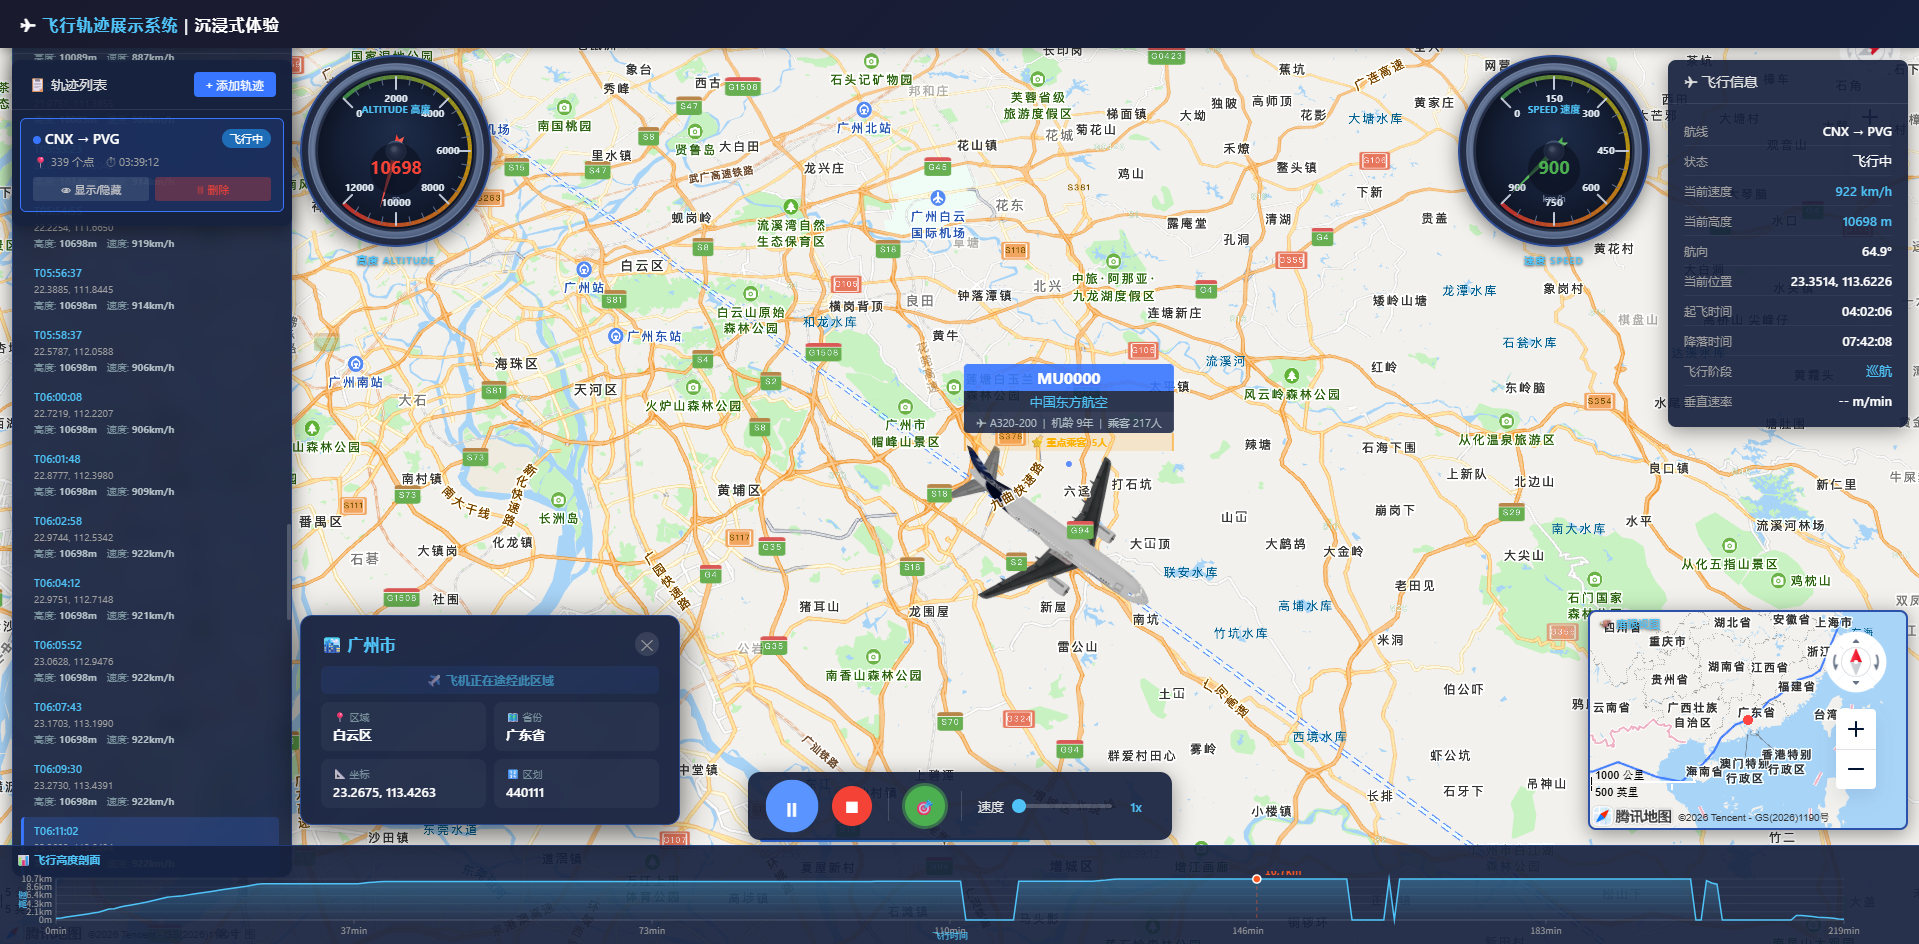 AI Visual Insight: This image shows the spatial distribution of flight trajectories on the map, highlighting how trajectory lines overlay the geographic basemap. It helps users observe route direction, waypoint density, and overall spatial coverage.
The project goals are divided into four capability groups
The first is data preparation, including Excel conversion, field normalization, and outlier cleaning. The second is trajectory management, including support for loading, displaying, and removing multiple routes. The third is flight animation, including the aircraft model, camera following, and playback controls. The fourth is information delivery, including a real-time metrics panel, altitude profile, and phase detection.
const flightPoint = {
  latitude: 31.197,
  longitude: 121.336,
  altitude_meters: 10350, // Current flight altitude
  speed_kmh: 842,         // Current flight speed
  heading: 78,            // Current heading angle
  timestamp: "2026-04-28 10:12:00"
};
This data structure defines the minimum core fields required for trajectory replay.
The data processing pipeline determines the upper limit of replay quality
The raw flight data comes from public data sources and typically includes fields such as flight number, departure and arrival airports, timestamp, latitude, longitude, altitude, speed, and heading. The project first converts unstructured data or web-scraped results into Excel, then uses Trae Solo to automatically parse them into trajectory JSON.
The key step here is not format conversion itself. It is standardizing units, filling missing values, sorting by time, and filtering out abnormal coordinates and speed values. Otherwise, the animation will show point jumps, reverse movement, or model jitter.
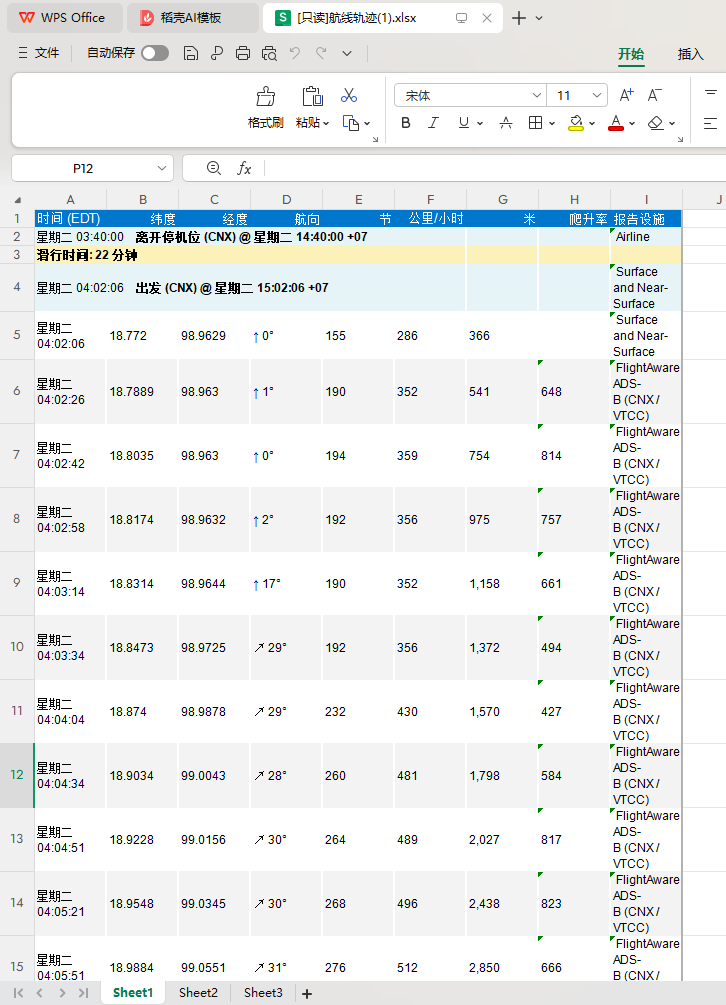 AI Visual Insight: This image shows the intermediate state where raw flight fields are transformed into a structured table. It emphasizes column name normalization, timestamp unification, and trajectory point aggregation by flight, which provides stable input for AI parsing.
Trae Solo converts Excel into renderable trajectories
Developers only need to describe the task in natural language, and Trae Solo can generate the cleaning and transformation logic. It is well suited for repetitive and rule-based data preprocessing, significantly reducing the cost of writing scripts by hand.
# Ask AI to generate the parsing logic
Parse this Excel file and generate a flight trajectory JSON file
This prompt instructs Trae Solo to automatically complete field recognition, cleaning, and JSON output.
The system uses a three-layer architecture: front-end rendering, AI parsing, and GIS support
The front-end layer handles the map container, trajectory list, control panel, audio, and charts. The AI parsing layer handles data cleaning, trajectory fitting, and flight phase detection. The GIS layer relies on Tencent Maps JavaScript API GL to provide the 3D basemap, model loading, and trajectory animation.
The advantage of this layered design is clear separation of responsibilities. You can replace the data source with a real-time flight API, and you can replace the phase detection rules with a more advanced machine learning model, while the rendering layer requires minimal changes.
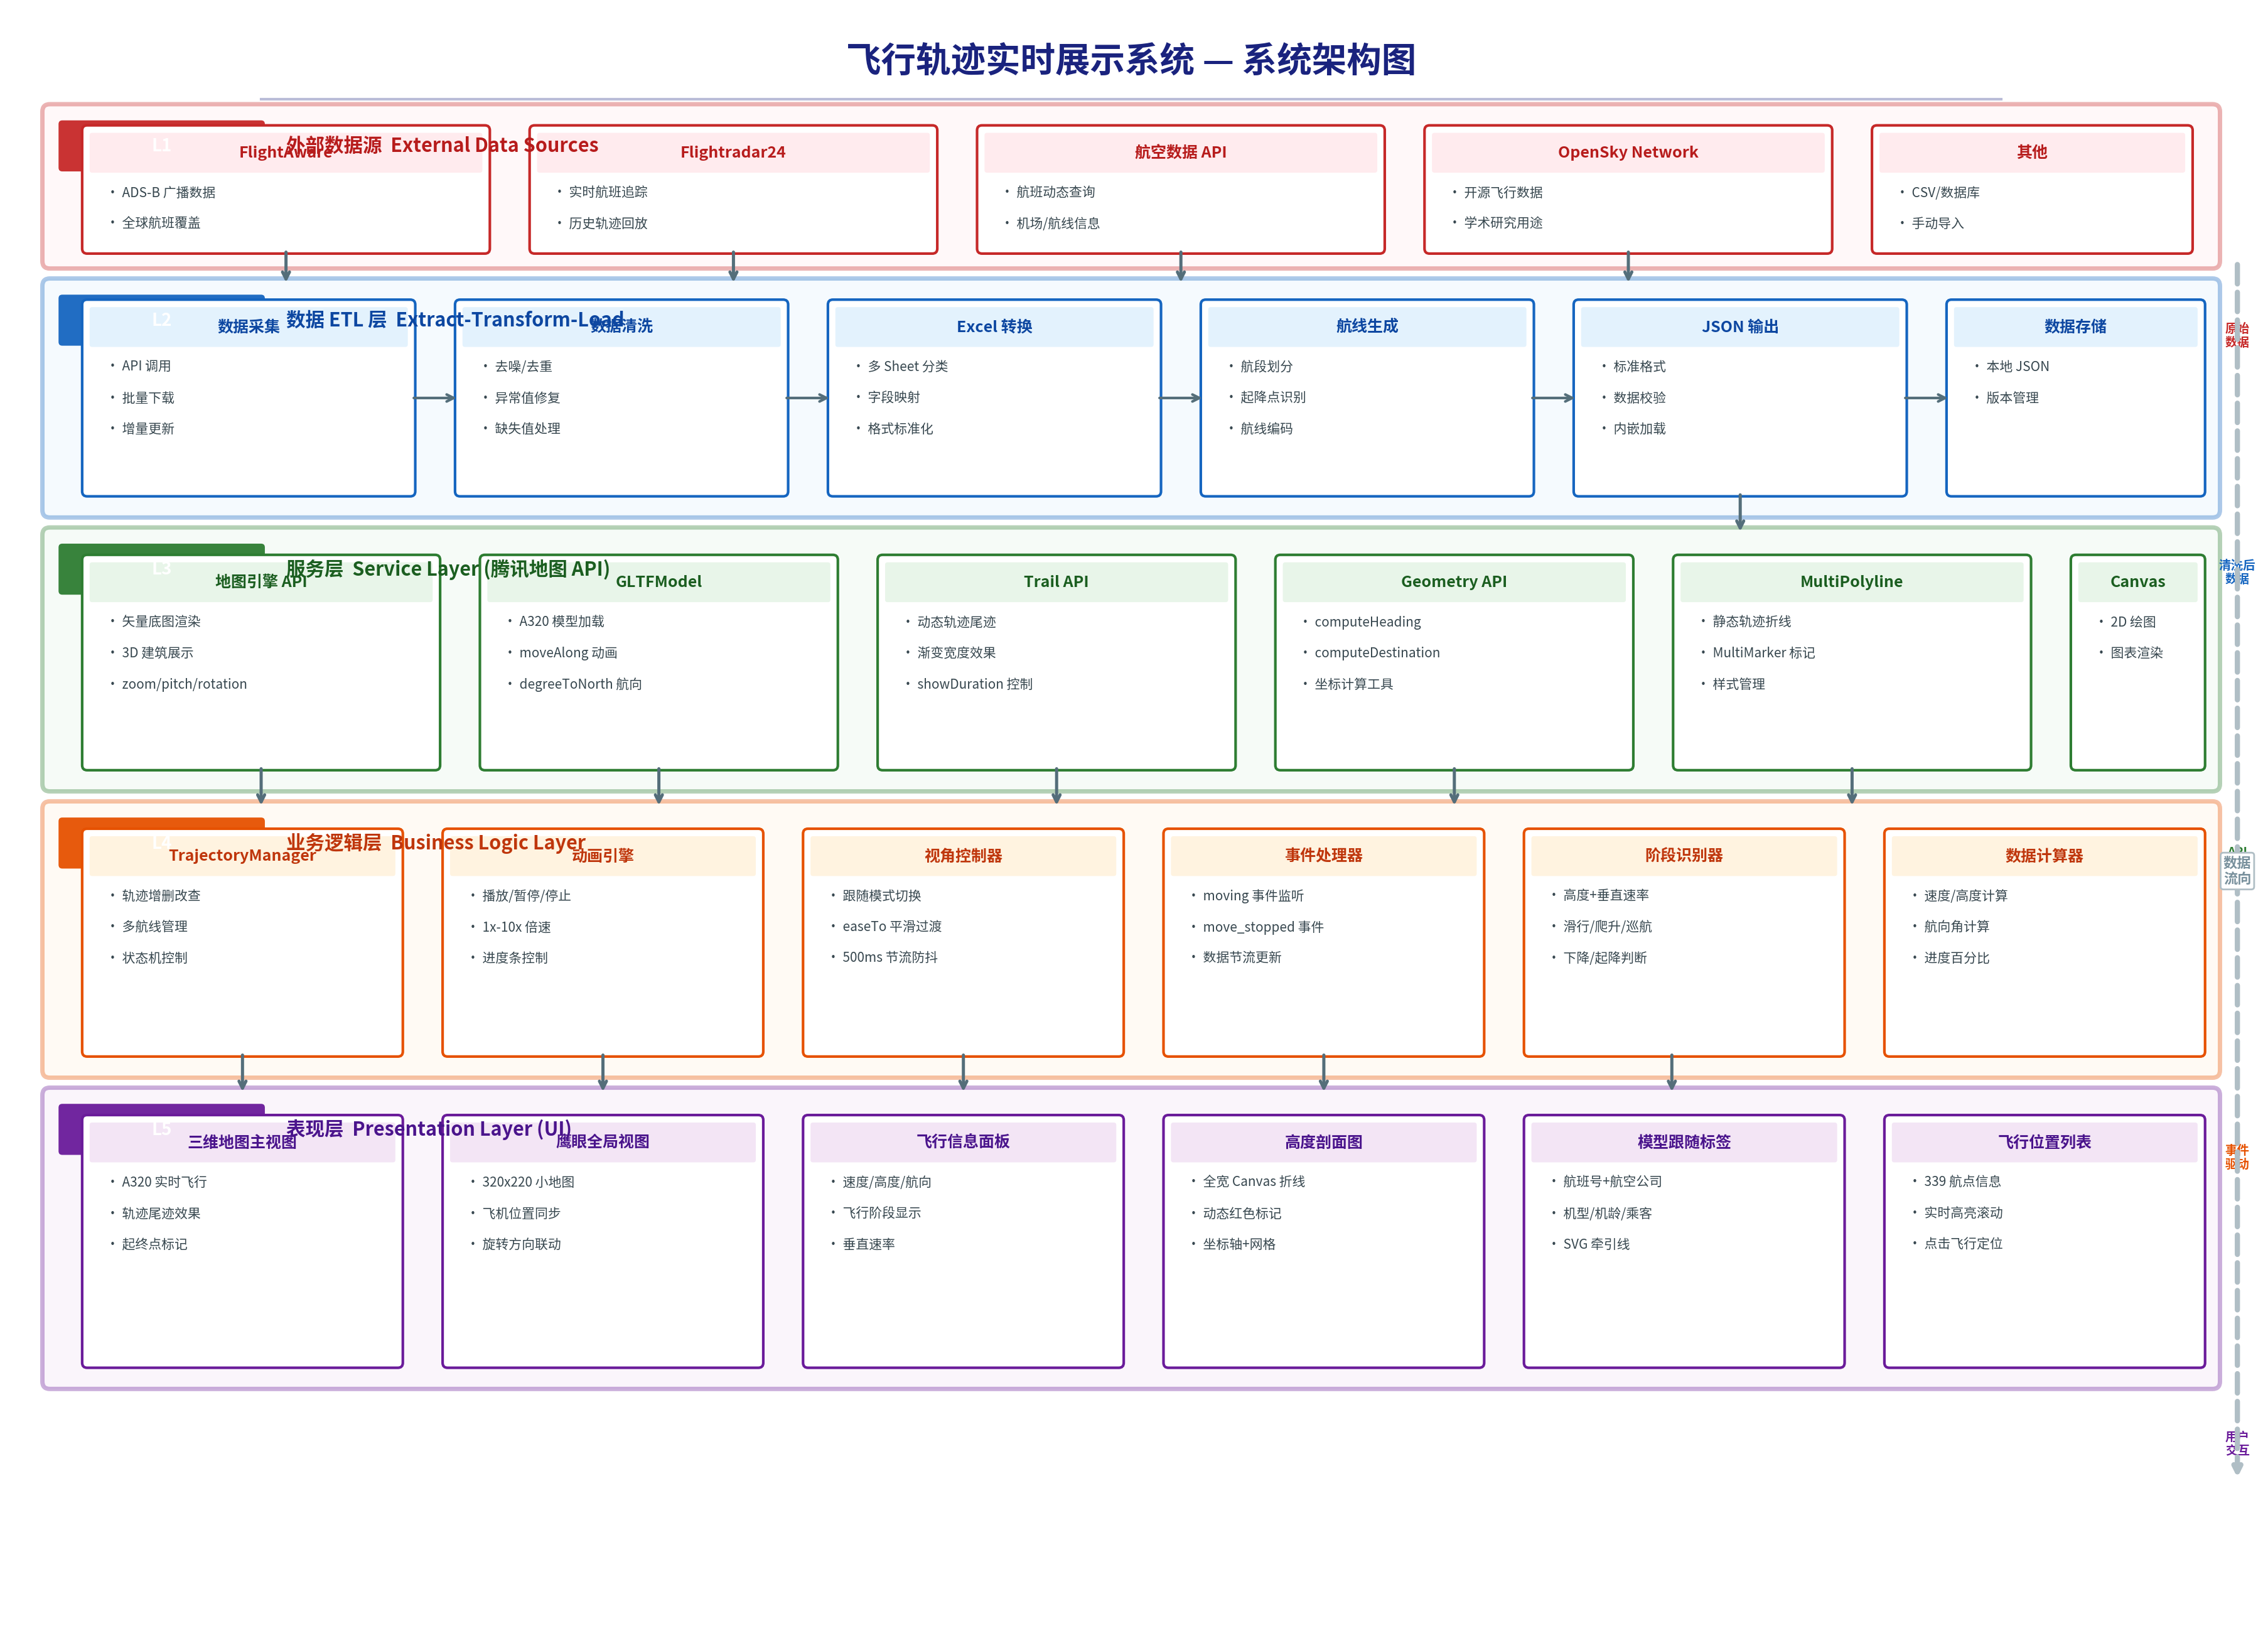 AI Visual Insight: This image presents a typical three-layer architecture in which data input passes through AI processing before entering the front-end GIS rendering layer. It shows how the system supports data source expansion, algorithm replacement, and UI reuse through decoupled design.
The key map capabilities focus on 3D rendering and replay
The project uses Tencent Maps GL to provide a 3D basemap along with rotation, pitch, and zoom interactions. It also uses GLTFModel to load an A320 model and drives smooth aircraft movement along the route through the moveAlong API.
The overview map is a practical addition. The main map provides immersive following, while the mini-map synchronizes direction and position so users can always maintain route-level situational awareness.
const map = new TMap.Map("container", {
  center: new TMap.LatLng(25.5, 106.5), // Initial center point
  zoom: 4,
  pitch: 30,  // Enable pitched view
  rotation: 0 // Initial rotation angle
});
This code initializes the 3D map.
Model orientation control is central to immersion
If the aircraft model does not rotate with the heading, the replay immediately feels inaccurate. The project calculates heading from adjacent trajectory points, normalizes the result to a range from 0 to 360 degrees, and continuously uses it to synchronize model rotation with the map camera.
It also adds a throttling mechanism to avoid triggering easeTo on every moving event. This reduces camera jitter and keeps the follow experience stable.
function getNormalizedHeading(from, to) {
  const heading = TMap.geometry.computeHeading(from, to); // Compute heading between two points
  return ((heading % 360) + 360) % 360; // Normalize to 0-360
}
This code calculates and normalizes model orientation.
The camera follow algorithm balances smoothness and readability
Following does not mean simply binding the map center to the aircraft position. The project adjusts camera distance based on speed and altitude, then controls rotation using 500 ms throttling and 800 ms smooth transitions to avoid abrupt visual changes during sharp turns.
To go further, the system precomputes the distance, start point, end point, and heading for each trajectory segment, laying the groundwork for custom interpolation and speed control. This makes the animation not just playable, but natural.
traj._segments.push({
  fromLat: prev.latitude,
  fromLng: prev.longitude,
  toLat: curr.latitude,
  toLng: curr.longitude,
  heading: heading,   // Heading of the current segment
  distance: dist      // Distance of the current segment
});
This code builds a segment cache for trajectory replay, making later interpolation and speed control easier.
Flight phase detection turns trajectory playback into an interpretable system
The project does more than show aircraft position. It infers the flight phase from altitude, vertical speed, speed, flap status, and landing gear status. Common phases include ground, taxi, climb, cruise, descent, and landing.
The value of this step lies in visualization linkage. Different phases can trigger different colors, audio cues, labels, and announcements, giving the replay stronger narrative power.
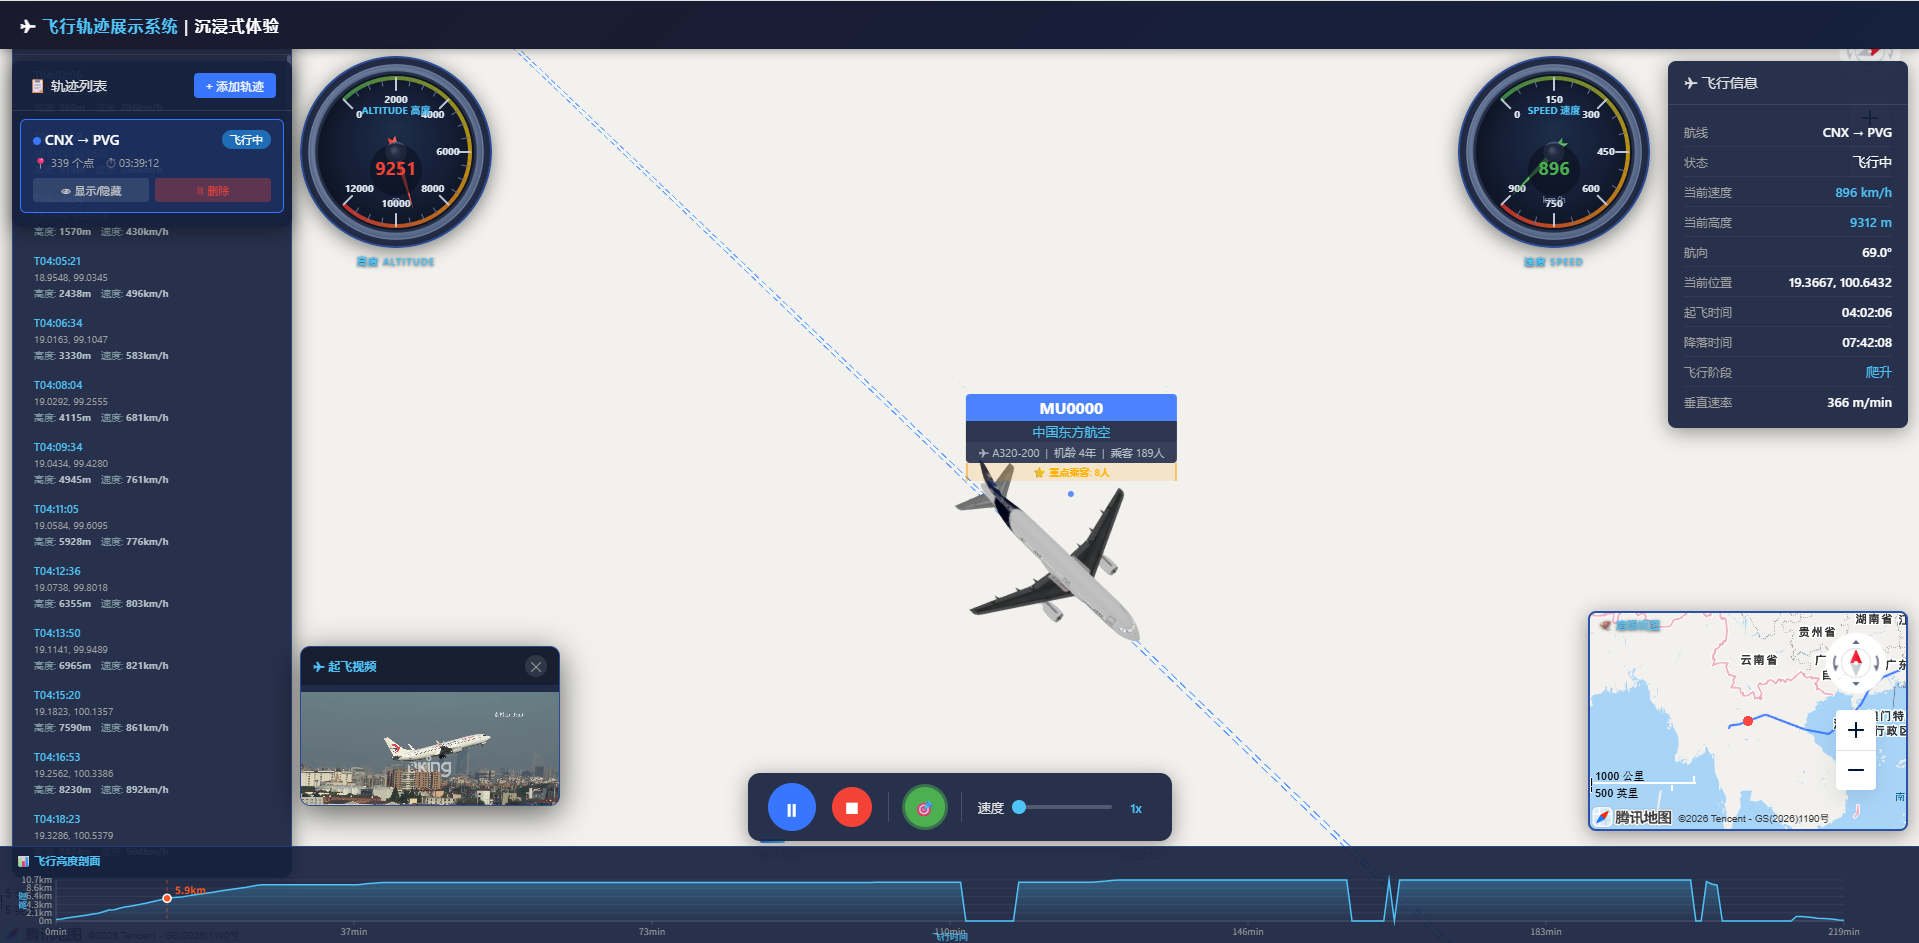 AI Visual Insight: This image shows a multimedia-linked interface during flight playback, typically including phase prompts, trajectory status, and audio scheduling entry points. It indicates that the system has connected timeline events with UI and audio triggers.
The result addresses both engineering and business needs
For developers, it validates the real productivity gains of Trae Solo in GIS visualization projects. For business users, it provides route replay, process explanation, anomaly investigation, and presentation-ready storytelling capabilities.
In particular, with features such as multi-route management, an information panel, altitude profile, and waypoint display, this project goes beyond the scope of a simple demo and is much closer to an extensible visual analytics application prototype.
The real innovation in this solution is reusable engineering capability
First, AI is applied to a high-frequency and repetitive data processing stage, rather than only for code completion. Second, Tencent Location Services handles 3D rendering and interaction, making visual output and performance more stable. Third, the project is designed for multi-scenario extensibility from the beginning, making it easier to connect real APIs, mobile clients, and additional flight rules.
As a result, the architecture is not limited to flight trajectories. It also applies to vehicle replay, vessel route tracking, drone inspection, and other spatiotemporal trajectory systems.
FAQ structured answers
1. Why convert to Excel first and then to JSON instead of parsing raw page data directly?
Because Excel is better suited for field mapping, sorting, and batch validation. It is also a more stable intermediate format for AI tools and reduces the parsing risk caused by changes in web page structure.
2. Why is throttling required for camera follow?
If map rotation, center, and pitch are updated continuously during high-frequency events, the result is jitter and frame drops. Throttling preserves the feeling of following while controlling rendering pressure.
3. Can this architecture connect to real-time flight data?
Yes. As long as you replace the offline Excel/JSON source with a real-time API stream and keep a unified trajectory field structure, both the rendering layer and the phase detection layer can continue to be reused.
[AI Readability Summary]
This article reconstructs a flight trajectory visualization project built with Trae Solo and Tencent Location Services. It covers data cleaning, trajectory parsing, 3D map rendering, model following, phase detection, and playback control, making it a strong reference for WebGIS, map development, and AI-assisted programming practice.