This C++ toolchain converts 3DGS PLY files into 3D Tiles. Its core capabilities include tiling, LOD generation, coordinate transformation, and Cesium rendering integration, solving the challenge of bringing Gaussian splatting data into GIS platforms. Keywords: 3DGS, 3D Tiles, Cesium.
Technical specifications define the implementation scope
| Parameter | Description |
|---|---|
| Primary language | C++ |
| Target protocols/specifications | 3D Tiles 1.1, glTF 2.0 |
| Coordinate systems | Input: ENU; Output: ECEF / georeferenced |
| GitHub stars | Not explicitly provided in the source |
| Core dependencies | nianticlabs/spz, TinyGLTF, Eigen |
| Rendering targets | CesiumJS 1.125, 1.130.1, 1.135, 1.139 |
This project closes the critical gap between 3DGS and GIS platforms
3D Gaussian Splatting delivers excellent reconstruction quality and real-time rendering performance, but raw PLY or splat data does not fit GIS engines directly. The problem is not rendering itself. The real challenge lies in data distribution, spatial organization, and standards compatibility.
The value of this approach is that it transforms Gaussian point clouds into a 3D Tiles structure that Cesium can load while preserving Gaussian attributes such as position, color, opacity, scale, rotation, and spherical harmonic coefficients. That allows 3DGS assets to enter the standard loading pipeline of map engines.
The online demo and open-source positioning clarify the project’s purpose
The original material includes a CesiumJS-based online demo that supports uploading PLY files, converting them into 3D Tiles, and browsing them directly in a 3D map. The prerequisite is that the input data uses the ENU coordinate system, and the user must provide a reference longitude, latitude, and elevation.
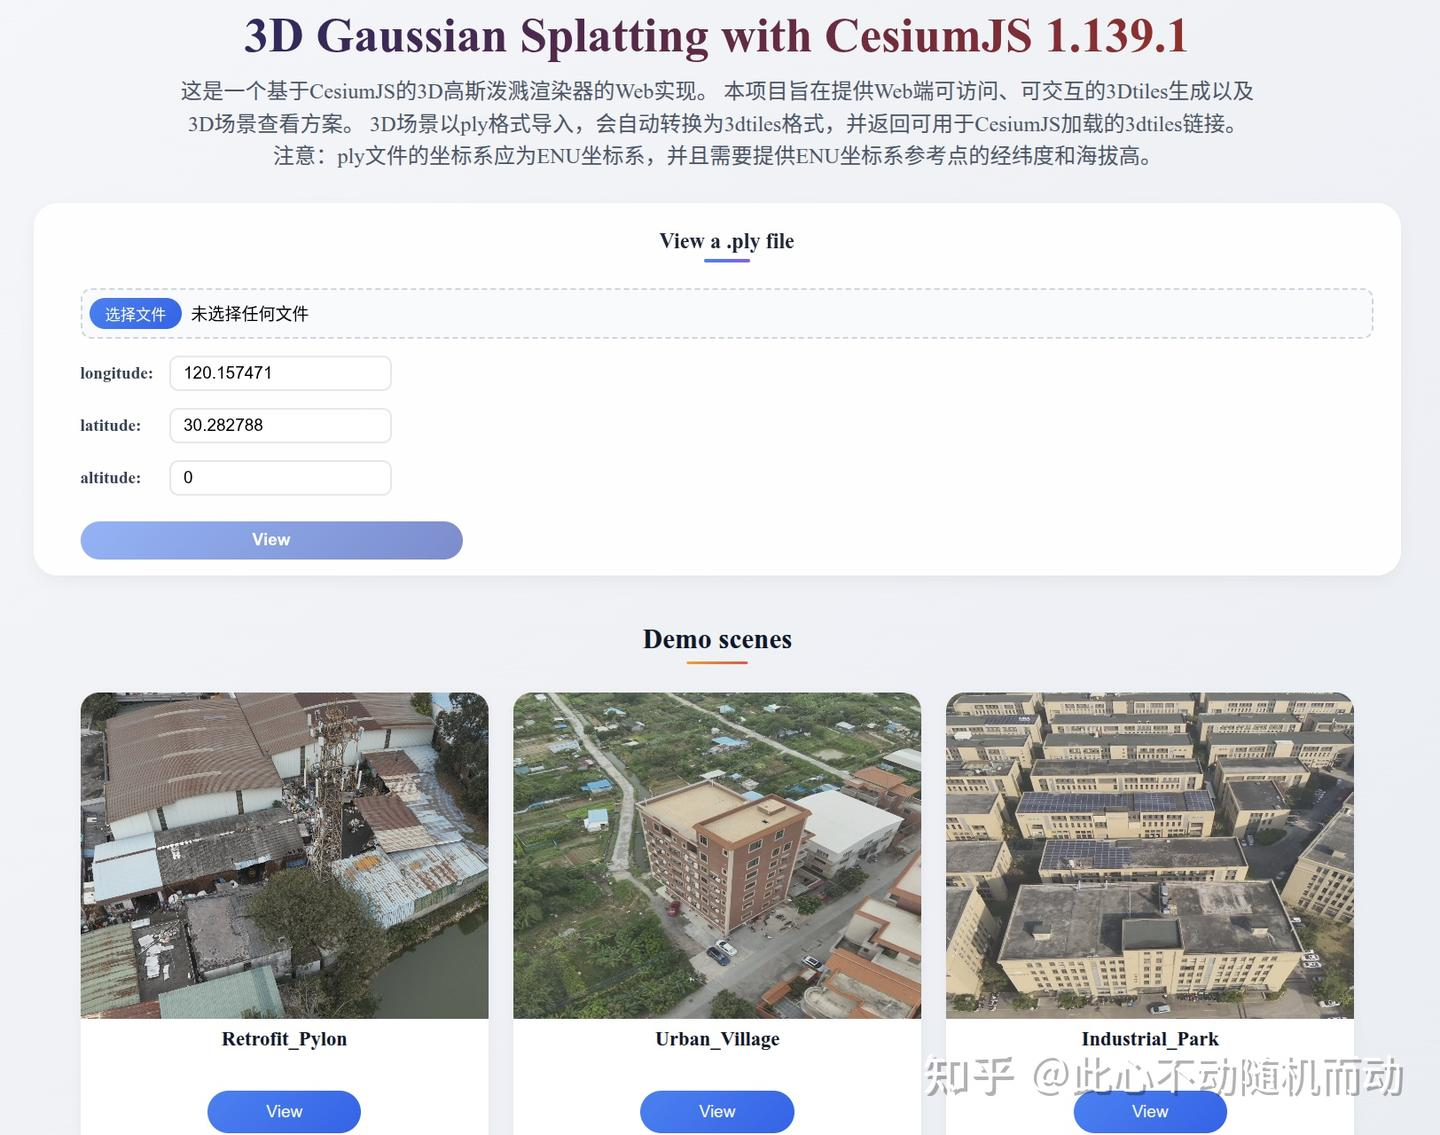 AI Visual Insight: This screenshot shows a typical web-based 3D GIS workspace. A panel on the left or top provides file upload and conversion entry points, while the center contains the Cesium scene viewport. The key validation point is that the Gaussian splatting data has been georeferenced and overlaid onto the globe scene rather than displayed as an isolated model preview.
The project is built around libTileSplat, a relatively low-level C++ conversion library. Its goal is not to train 3DGS models, but to normalize and export existing Gaussian point cloud outputs for the Cesium ecosystem.
The conversion pipeline is divided into four stable modules
The full workflow can be summarized as follows: read the PLY file, tile by space, clean tile data, build LODs, and generate 3D Tiles plus their content files. This decomposition makes it easier to replace local algorithms later without affecting the final output specification.
Gaussian point cloud tiling is the first step toward large-scale visualization
The project uses the parsing capability provided by nianticlabs/spz to read 3DGS PLY files and supports both ASCII and binary formats. It then assigns Gaussian points into different spatial blocks based on the configured tile width and height.
spz::GaussianCloud cloud;
// Read a 3DGS PLY file, compatible with ASCII and binary formats
cloud = spz::loadSplatFromPly(plyPath);

for (const auto& g : cloud.gaussians) {
    // Compute the tile index from the planar extent
    int tx = static_cast
<int>((g.position.x() - minX) / tileWidth);
    int ty = static_cast
<int>((g.position.y() - minY) / tileHeight);
    tiles[std::make_pair(tx, ty)].push_back(g); // Put the Gaussian point into the corresponding tile
}
This code buckets raw Gaussian points by a spatial grid and lays the foundation for subsequent LOD generation and 3D Tiles tree organization.
Tile data cleaning determines downstream hierarchy quality
Although the original material does not expand on the cleaning code, its role in the pipeline is clear: remove outliers, compress redundancy, and normalize attribute distributions. If this step is weak, LOD downsampling can introduce color drift, broken edges, and opacity distortion.
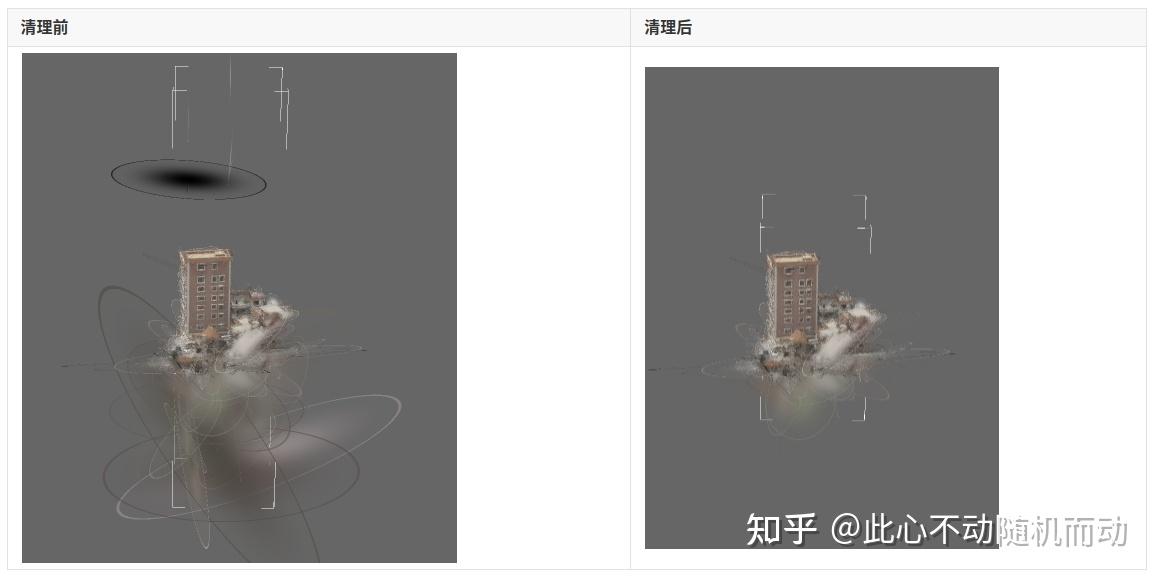 AI Visual Insight: This image appears to illustrate an intermediate result after tiling or data cleaning. It highlights the discrete spatial distribution and local clustering behavior of Gaussian points. From an engineering perspective, you can read it as evidence that the data has already been clipped into manageable local blocks before LOD generation while still preserving a degree of spatial continuity.
LOD generation relies on attribute-preserving aggregation, not simple thinning
This approach builds lower-level representations through neighborhood aggregation rather than keeping only a subset of points. The process includes KD-tree nearest-neighbor search, opacity-based weight computation, and weighted averaging of attributes such as position, color, scale, and rotation.
float weight = 1.0f / (1.0f + std::exp(-opacity)); // Map opacity to a weight
avgPos += weight * neighbor.position;              // Weighted average of position
avgColor += weight * neighbor.color;               // Weighted average of color
avgScale += weight * neighbor.scale;               // Weighted average of scale
avgRot = Slerp(avgRot, neighbor.rotation, weight); // Approximate aggregation through quaternion interpolation
The goal of this logic is to reduce data volume while preserving the visual centroid, color energy, and orientation stability of Gaussian clusters as much as possible.
Opacity weighting is critical to visual fidelity
The visual contribution of a Gaussian splat is not determined by position alone. Splats with higher opacity often have a much greater impact on the final image, so using a sigmoid-style weight function during aggregation prevents low-contribution points from dominating the LOD result.
This is closer to actual rendering behavior than a pure geometric average. It is also better suited to GIS-style distant viewing, where overall appearance consistency matters more than per-point precision.
The 3D Tiles export stage determines whether Cesium can load the data reliably
The export process has three steps: generate SPZ first, package it into glTF/GLB with the required extensions, and finally build tileset.json. In essence, this packs Gaussian data into a content declaration that 3D Tiles 1.1 can recognize.
{
  "asset": {
    "version": "1.1"
  },
  "extensions": {
    "3DTILES_content_gltf": {
      "extensionsRequired": [
        "KHR_gaussian_splatting",
        "KHR_gaussian_splatting_compression_spz_2"
      ],
      "extensionsUsed": [
        "KHR_gaussian_splatting",
        "KHR_gaussian_splatting_compression_spz_2"
      ]
    }
  },
  "extensionsUsed": [
    "3DTILES_content_gltf"
  ],
  "geometricError": 8.0
}
This tileset fragment shows that the tile content is not a traditional b3dm payload. Instead, it references glTF content with Gaussian extensions directly through 3DTILES_content_gltf.
glTF generation must track extension version changes closely
The source material specifically emphasizes how quickly Cesium versions evolve. The splat-shader branch in 1.125 offered experimental support. Starting with 1.130.1, support was merged into the mainline codebase. After 1.135, the extension model migrated from KHR_spz_gaussian_splats_compression to KHR_gaussian_splatting and KHR_gaussian_splatting_compression_spz_2.
This means the converter cannot merely output a format that “runs.” It must align strictly with the target Cesium version. Otherwise, the most common failure mode is that the extension name looks correct, but its semantics are incompatible, causing load failures or rendering artifacts.
Version compatibility has become a decisive engineering factor
If your target is a production Cesium release rather than a historical experimental branch, aligning with the extension system used by 1.135 and later is the safer choice. This is especially true for scenarios involving multiple tilesets, model matrix changes, and very large splat counts, where newer versions fix a range of flickering, crashes, and sorting race conditions.
This matters even more for city-scale GIS visualization because 3DGS datasets are large, viewpoints move frequently, and load/unload activity is intense. Any instability on the rendering side will be amplified immediately.
FAQ provides practical answers for implementation decisions
Q1: Why must the input PLY use the ENU coordinate system?
A: Because the project must reliably map local engineering coordinates into geospatial space. If the input is not ENU, the downstream ECEF conversion and map positioning will be distorted, and the model may shift, flip, or land in the wrong location.
Q2: Why not load the PLY directly into Cesium instead of converting it to 3D Tiles?
A: 3D Tiles solves tiled loading, hierarchical scheduling, spatial indexing, and streaming. A PLY file is only a raw data file and does not provide the orchestration capabilities required by large-scale GIS scenes.
Q3: What is most likely to be lost during LOD aggregation?
A: The most common losses are color consistency, opacity contribution, and rotational orientation. If you only thin points by position, distant views can become gray, boundaries can blur, and visual structure can collapse. That is why attribute-weighted aggregation is necessary.
Core summary captures the GIS-oriented processing strategy
This article reconstructs a 3DGS data processing workflow for GIS scenarios: tile Gaussian point clouds stored as PLY in the ENU coordinate system, clean the data, build LODs, and export Cesium-compatible 3D Tiles/GLB output for large-scale 3D map visualization.