TDengine IDMP uses AI-native capabilities to upgrade industrial data consumption from manual querying to proactive insight delivery. It addresses common industrial challenges such as high analysis barriers, rule-dependent anomaly detection, and slow insight generation. Core keywords: TDengine, Industrial AI, Time-Series Database.
Technical Specification Snapshot
| Parameter | Description |
|---|---|
| Core Platform | TDengine IDMP + TDengine TSDB |
| Primary Language | Not explicitly stated in the source; the product system centers on industrial data platform capabilities |
| Data Types | Time-series data, asset context, event data |
| Interaction Modes | Natural language, automated insights, visual dashboard generation |
| Analysis Paradigm | Shifting from rule-driven to learning-driven |
| Typical Capabilities | Anomaly detection, root cause analysis, real-time visualization, proactive push notifications |
| Protocols / Interfaces | Not explicitly stated in the source; can be categorized as industrial data ingestion and time-series analysis interfaces |
| GitHub Stars | Not provided in the source |
| Core Dependencies | AI capabilities, asset modeling, event modeling, time-series database support |
A Structural Gap Has Long Existed Between Industrial Data and Business Insights
Industrial enterprises do not lack data. Sensors, PLCs, SCADA systems, industrial internet platforms, and real-time databases already collect and store massive volumes of time-series data continuously.
What is truly scarce is not the ability to see data, but the ability to rapidly convert data into actionable insights. Most systems solve data collection, storage, and visualization, but they do not remove the high barrier of analysis design, rule configuration, and result interpretation.
Traditional industrial analysis workflows are difficult to scale
In the traditional model, producing a useful insight usually requires multiple stages: process understanding, data filtering, rule definition, model building, and result interpretation. Data scientists understand algorithms, but may not understand the shop floor. Process engineers understand equipment, but may not know how to build models.
# Simplified illustration of traditional anomaly detection
value = sensor_value
threshold = 80  # Manually configured fixed threshold

if value > threshold:  # Mark as abnormal if the threshold is exceeded
    alert = True
else:
    alert = False
This type of method depends on manually defined thresholds and often produces false positives or misses anomalies when operating conditions change.
AI Is Rewriting Industrial Analytics from Query-Driven to Insight-Driven
The source makes a key point: AI is not just changing a single feature. It is reshaping the entire data consumption pipeline. Users no longer need to know exactly what to ask first, and the system no longer waits for a query or dashboard configuration before beginning analysis.
The direction represented by TDengine IDMP is proactive insight delivery without explicit prompting. The system continuously combines data and context to automatically generate dashboards, anomaly alerts, and operational insights. This shifts the model from people searching for data to data proactively delivering answers.
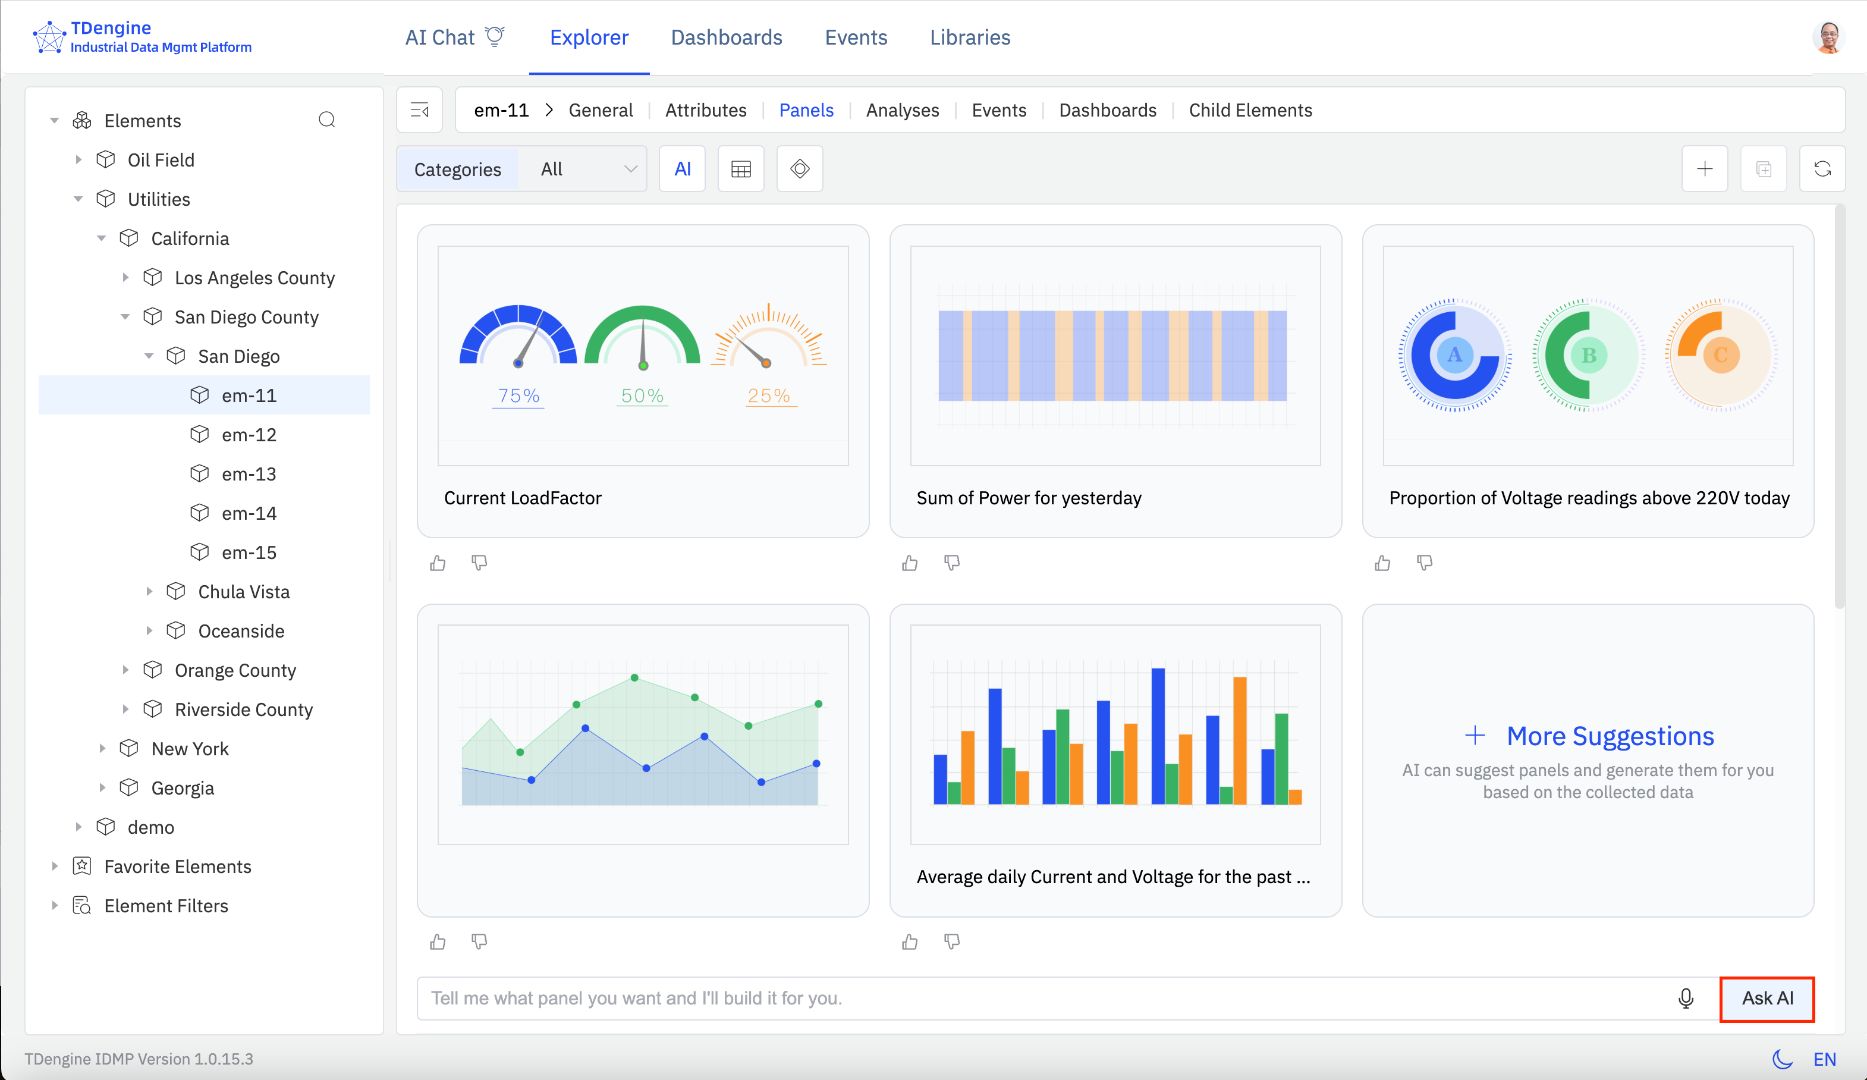
 AI Visual Insight: This image illustrates the interface evolution from a traditional industrial data platform to an AI-native insight platform. Key elements typically include automatically generated visual charts, equipment status cards, and anomaly alert regions. It shows that the system no longer depends on manually built dashboards, but instead organizes monitoring views and analytical results proactively around real-time data streams.
The core of proactive insight delivery is not Q&A, but active scenario understanding
In complex industrial systems, the real challenge is not executing SQL. It is defining the problem itself. Users often do not know which device, time range, or metric group deserves attention.
An AI-native platform continuously analyzes time-series data, asset relationships, and event context to proactively identify patterns worth attention, then converts the results into charts, alerts, and explanations. This mechanism directly shortens the path from data to decision.
-- Example: query the average temperature by device for the last hour
SELECT device_id, AVG(temp) AS avg_temp
FROM meters
WHERE ts > NOW - 1h
GROUP BY device_id;
Queries like this still matter, but in an AI-driven model, the system increasingly generates and encapsulates them automatically.
Learning-Based Anomaly Detection Fits Real Operating Conditions Better Than Manual Rules
Anomaly detection is one of the most common and one of the most failure-prone analysis tasks in industrial environments. Traditional approaches rely on thresholds, condition combinations, and expert knowledge. They are expensive to maintain and highly sensitive to operating-condition drift.
The key shift in the AI model is that the system learns normal behavior directly from historical data. When patterns deviate, the platform automatically identifies anomalies without requiring engineers to predefine every rule.
Moving from rule configuration to pattern learning creates more direct benefits
First, it reduces manual maintenance. Second, it improves accuracy in complex scenarios. Third, it allows small and midsize enterprises to gain analytical capabilities that previously required specialized expert teams.
 AI Visual Insight: This image appears to explain an AI-driven anomaly analysis or insight-generation workflow. It typically presents multidimensional metrics, trend comparisons, and aggregated alert information. Its technical meaning is that the system can extract patterns from continuous time series, automatically detect behavioral deviations, and map anomaly results into readable business views.
# Minimal pseudocode for learning-driven anomaly detection
baseline = model.predict(history_window)  # Learn the normal pattern from the historical window
score = abs(current_value - baseline)     # Calculate the current deviation

if score > dynamic_limit:  # The dynamic threshold is determined by the model or statistical features
    alert = "Anomaly detected"
Its core value is that thresholds are no longer fixed. They change dynamically with the operating scenario.
AI-Native Platforms Are Upgrading the System Role from Tool to Assistant
Traditional platforms require users to learn menus, reports, and configuration workflows. AI-native platforms behave more like industrial analysis assistants. Users can initiate analysis with natural language, or they can simply receive insights pushed proactively by the system.
At a deeper architectural level, the combination of TDengine IDMP and TDengine TSDB shows a clear separation of responsibilities. TSDB provides high-performance, real-time time-series data storage and query capabilities. IDMP handles context organization, AI analysis, and insight output.
Without context, AI can process data but cannot understand industrial semantics
The source especially emphasizes the importance of asset-centric modeling and event-centric modeling. This point is critical.
If you only have isolated tags and timestamps, AI can at most detect that a value changed. Once data is mapped to equipment, production lines, process stages, and operating events, AI can determine whether the pattern reflects startup and shutdown behavior, steady-state fluctuation, or an early sign of failure.
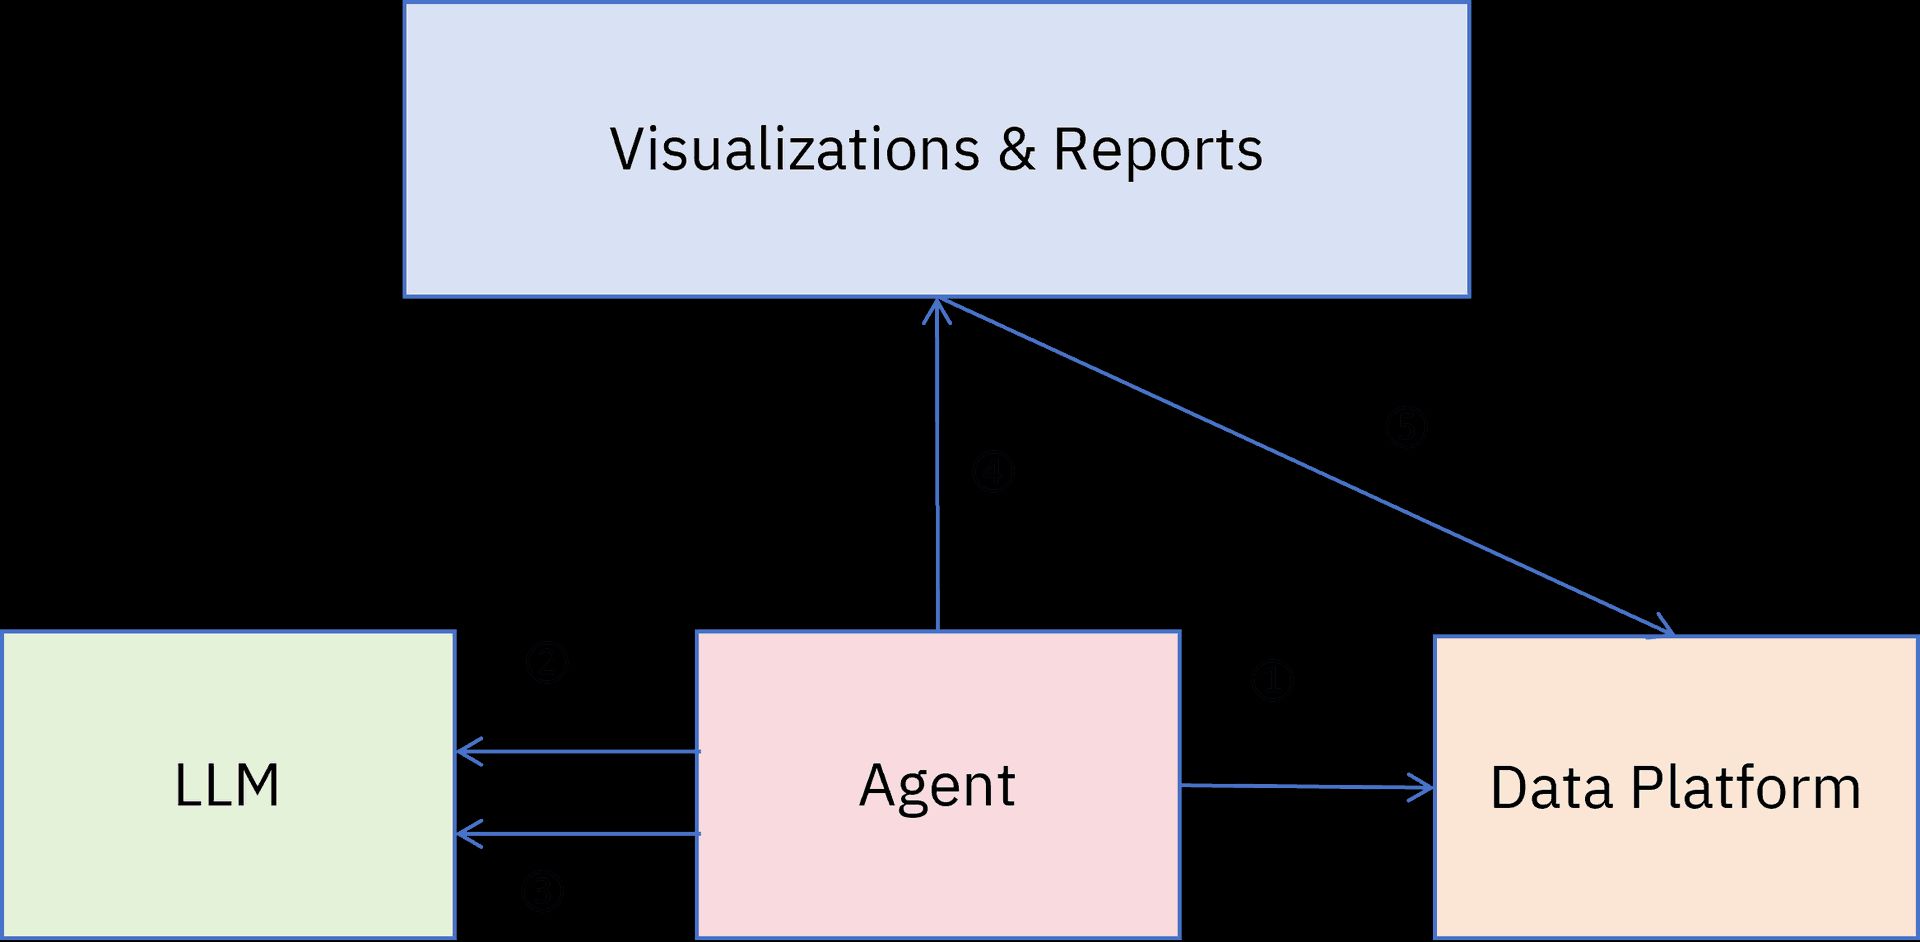
 AI Visual Insight: This image can be understood as a closed-loop view of platform capabilities. It typically presents several layers at once, including data ingestion, modeling, analysis, insight generation, and business response. Its technical focus is to show that industrial AI is not a single-model capability. It depends on the combination of a time-series database, asset models, event models, and visualization orchestration to create a deployable insight system.
{
  "asset": "Compressor A-102",
  "event": "Startup phase",
  "signal": ["Temperature", "Vibration", "Pressure"],
  "insight": "Vibration deviates from the historical baseline under similar operating conditions"
}
This structured example shows that insight must be built on top of asset and event context.
AI Is Significantly Lowering the Organizational Cost of Gaining Industrial Insights
The value of this type of platform is not only a technical upgrade, but also an organizational efficiency upgrade. In the past, a single analysis request might require coordination across data teams, algorithm teams, and vendors. Now, the system can generate results instantly for many scenarios.
For large enterprises, this means shorter analytics delivery cycles. For small and midsize enterprises, it means they can gain basic anomaly detection, trend interpretation, and assisted root cause analysis without building a full data science team.
FAQ
1. What is the relationship between TDengine IDMP and TDengine TSDB?
TSDB provides the high-performance storage and query foundation for time-series data. IDMP adds asset modeling, event modeling, AI analysis, and insight generation on top of it. In other words, TSDB is the underlying data engine, while IDMP is the intelligent platform layer above it.
2. What industrial scenarios are suitable for proactive insight delivery without explicit prompting?
It is well suited for environments with many monitoring points, complex operating conditions, and high manual inspection costs, such as manufacturing, energy, and process industries. Its advantage is that the system proactively discovers anomalies, trends, and key dashboards instead of waiting for people to query each item manually.
3. Why is context modeling more important than simply ingesting more data?
Because industrial insight depends on semantics. Only when data is associated with equipment, process stages, and event states can AI distinguish normal fluctuation from true anomalies and produce actionable results rather than merely visual outputs.
Core Summary: This article reconstructs the collaborative value of TDengine IDMP and TDengine TSDB, explaining how AI shifts industrial analytics from query-driven workflows to insight-driven workflows. It lowers the barrier to anomaly detection, root cause analysis, and visualization, while highlighting the importance of asset and event context for high-quality industrial insights.