Pushgateway fills the observability gap in Prometheus’s pull-based model for short-lived jobs. It lets backup scripts, CI/CD pipelines, and batch jobs actively push metrics before exit, and then allows Prometheus to scrape them centrally. The core challenge is that these jobs are ephemeral, their endpoints do not persist, and their instances often disappear. Keywords: Prometheus, Pushgateway, offline jobs.
Technical Specification Snapshot
| Parameter | Description |
|---|---|
| Core languages | Go (Pushgateway/Prometheus), Shell, Python (reporting scripts) |
| Collection protocol | HTTP /metrics, Prometheus text format |
| Deployment methods | Binary installation, Docker installation |
| Listening ports | Pushgateway 9091, Prometheus 9090 |
| Versions used in this article | Prometheus v3.5.0, Pushgateway 1.0.0/1.11.2, Docker 26.1.4 |
| Core dependencies | systemd, curl, requests, Docker |
| Applicable scenarios | Backup scripts, data processing, CI/CD, one-off jobs |
Pushgateway Solves Prometheus Visibility Gaps for Short-Lived Jobs
Prometheus uses a pull model by default, which works well for long-running services. A target application continuously exposes /metrics, and Prometheus scrapes it on a schedule.
The problem is that offline scripts, scheduled tasks, and batch processes often finish within seconds. By the time Prometheus performs the next scrape, the process has already exited, so the metrics are lost.
The Monitoring Flow Works Through an Intermediary Layer
Pushgateway acts as a metrics inbox. A short-lived job actively pushes its results to Pushgateway before it exits, and Prometheus then scrapes Pushgateway like any other target.
Short-lived job -> HTTP Push -> Pushgateway -> Prometheus Pull -> Grafana/AlertmanagerThe value of this flow is straightforward: it preserves Prometheus’s primary operating model while adding an observability entry point for one-off jobs.
 AI Visual Insight: This diagram shows Pushgateway as the relay layer between short-lived jobs and Prometheus. It highlights the decoupled design of “jobs push actively, the platform scrapes centrally,” which is well suited to preserving metrics from transient workloads such as backups, pipelines, and batch processing.
Pushgateway Supports Fast Deployment with Either a Binary or Docker
A binary installation fits environments that already use Linux hosts and a systemd-based operations model. Docker deployment is lighter and works well for quick validation.
Start Pushgateway with systemd
tar -zxvf pushgateway-1.11.2.linux-amd64.tar.gz
mv pushgateway-1.11.2.linux-amd64 /app/pushgateway

# Create a service file and enable the listening port and admin API
cat >/etc/systemd/system/pushgateway.service <<'EOF'
[Unit]
Description=Pushgateway for Prometheus
After=network-online.target

[Service]
Type=simple
User=prometheus
Group=prometheus
ExecStart=/app/pushgateway/pushgateway \
  --web.listen-address=:9091 \
  --web.enable-admin-api \
  --log.level=info
WorkingDirectory=/app/pushgateway
Restart=on-failure

[Install]
WantedBy=multi-user.target
EOF

# Set ownership and permissions, then start the service
chown -R prometheus:prometheus /app/pushgateway
chmod +x /app/pushgateway/pushgateway
systemctl daemon-reload
systemctl enable --now pushgateway
This configuration handles extraction, service registration, and startup on boot. It is the most common deployment path on production Linux hosts.
Running with Docker Fits Demo and Validation Scenarios Better
docker pull prom/pushgateway
# Map port 9091 and start the container quickly
docker run -d \
--name=pg \
-p 9091:9091 \
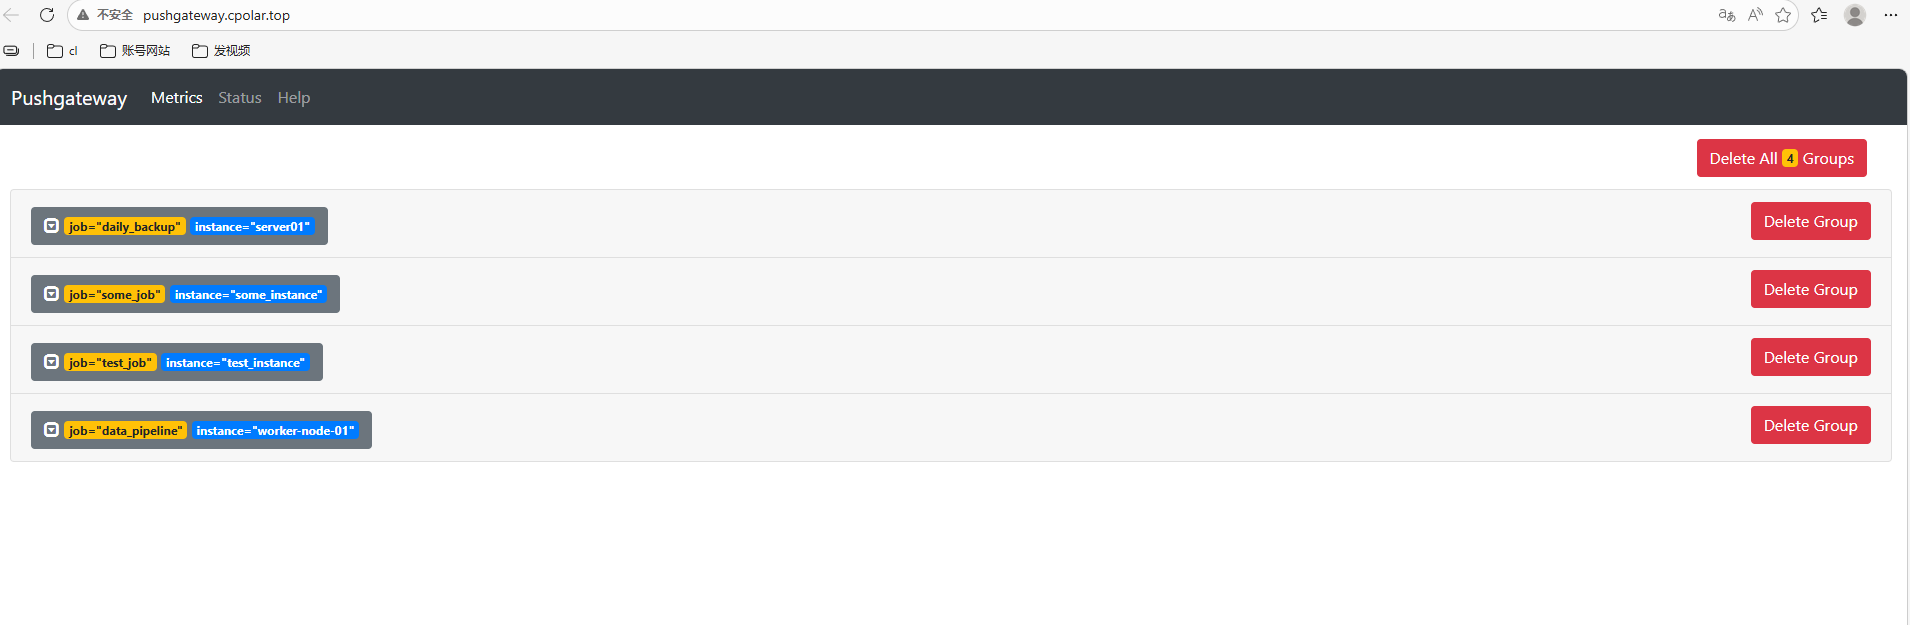
prom/pushgatewayThis command set works well for local validation. After startup, you can open `http://
:9091` to access the UI. 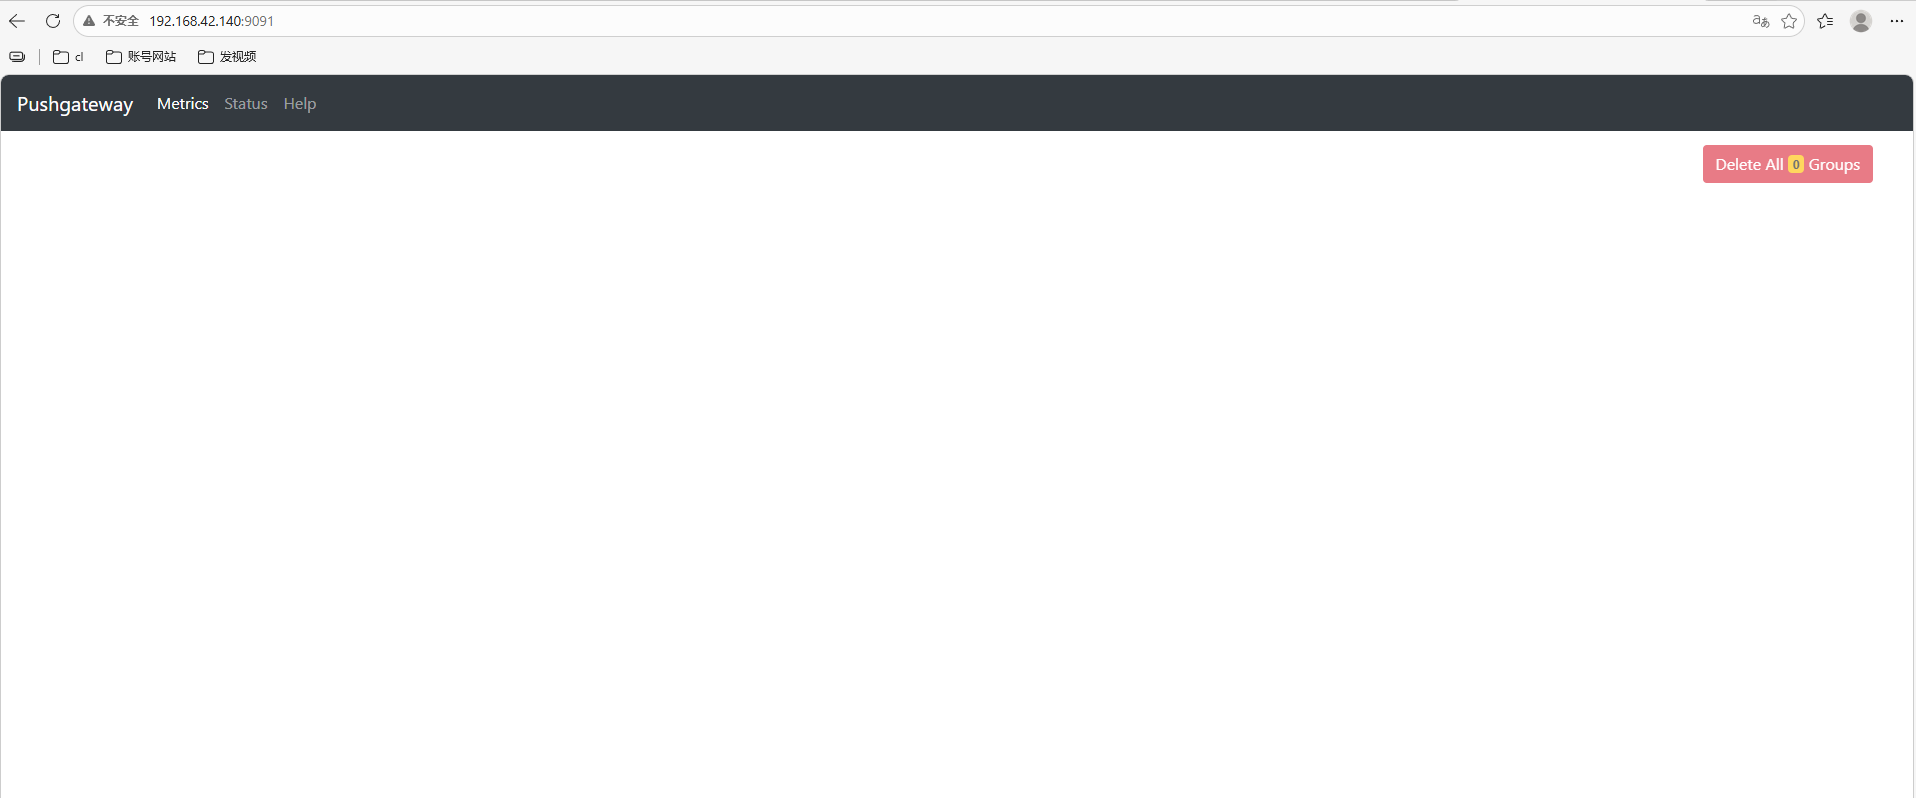 **AI Visual Insight:** This screenshot shows the initial Pushgateway Web UI state. No business metrics have been pushed yet, but it confirms that the service has started correctly and is ready to receive data. 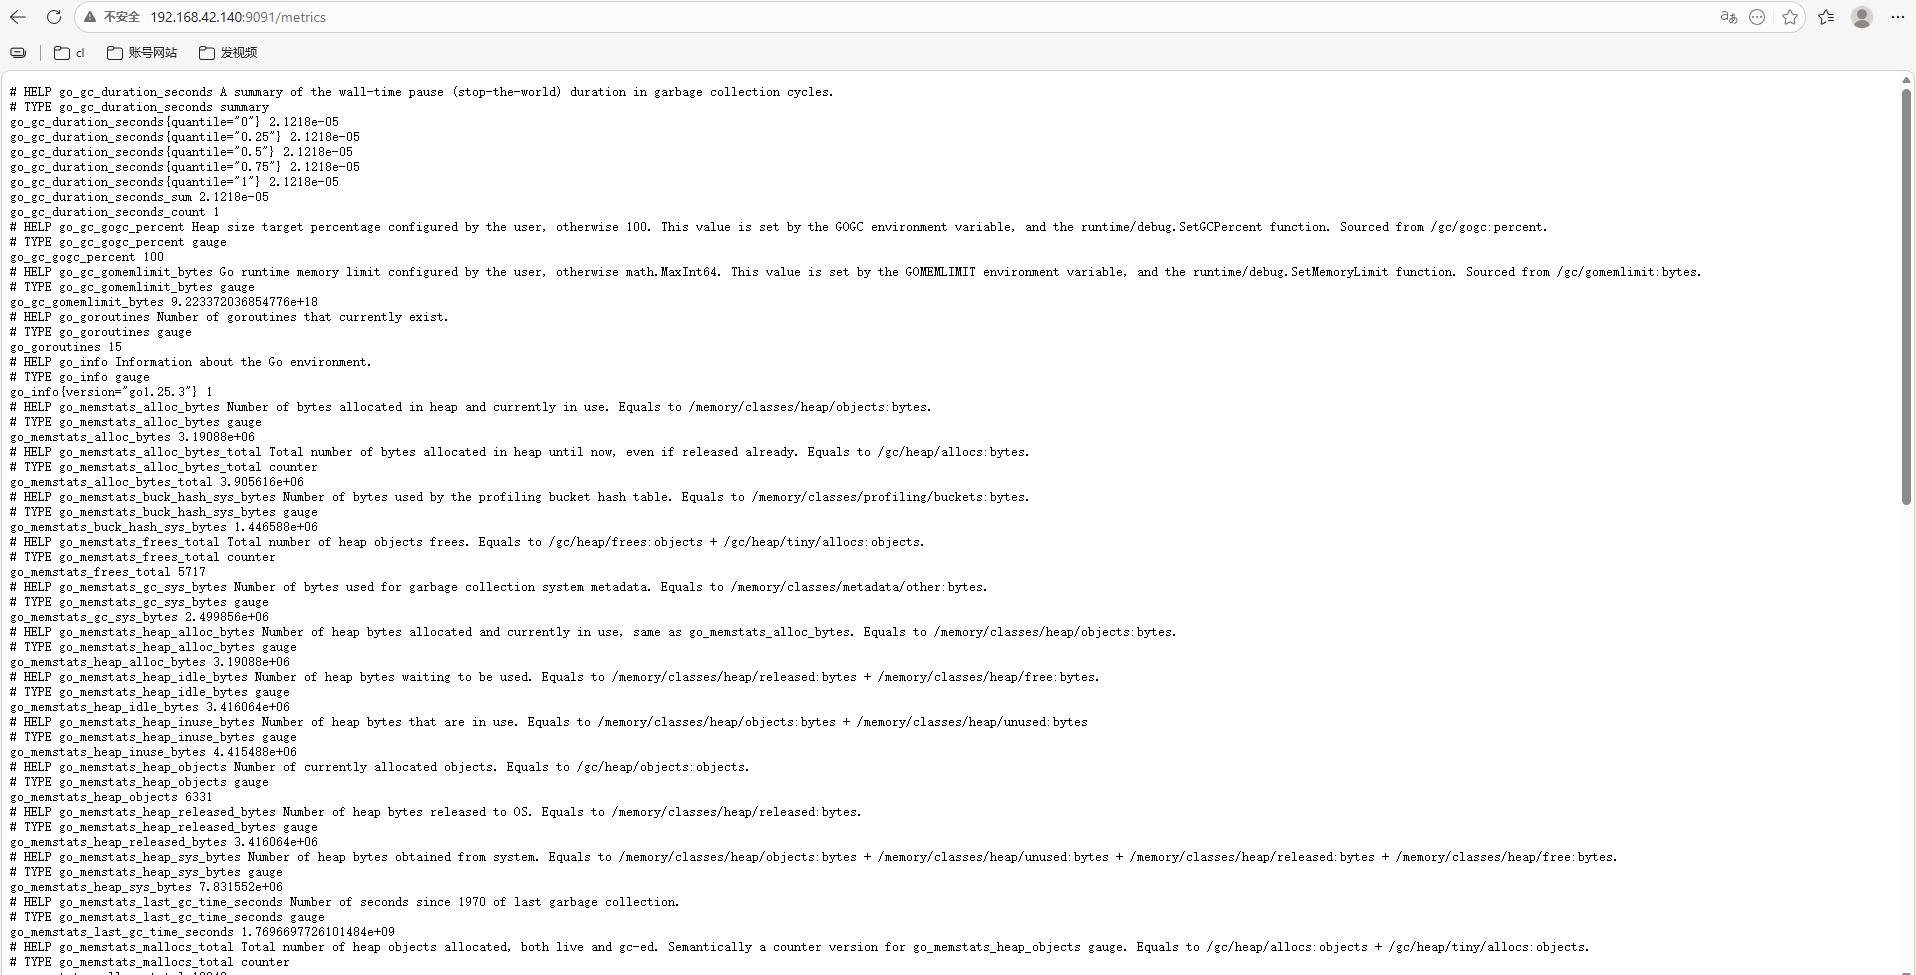 **AI Visual Insight:** This screenshot shows the raw `/metrics` output, including Go runtime and process-level metrics. It demonstrates that Pushgateway itself can also be monitored, which helps verify service health and the scrape path. ## Prometheus Must Explicitly Scrape Pushgateway to Complete the Pipeline Pushgateway only receives and temporarily stores metrics. It does not handle alerting or long-term storage. Prometheus still performs the actual time series collection. ### Add a Scrape Job in Prometheus “`yaml scrape_configs: – job_name: pushgateway static_configs: – targets: [‘localhost:9091’] # Scrape metrics exposed by Pushgateway labels: app: “pushgateway” # Add identifying labels to the target “` This configuration adds Pushgateway to Prometheus’s scrape scope. After that, you can verify its status on the Targets page. 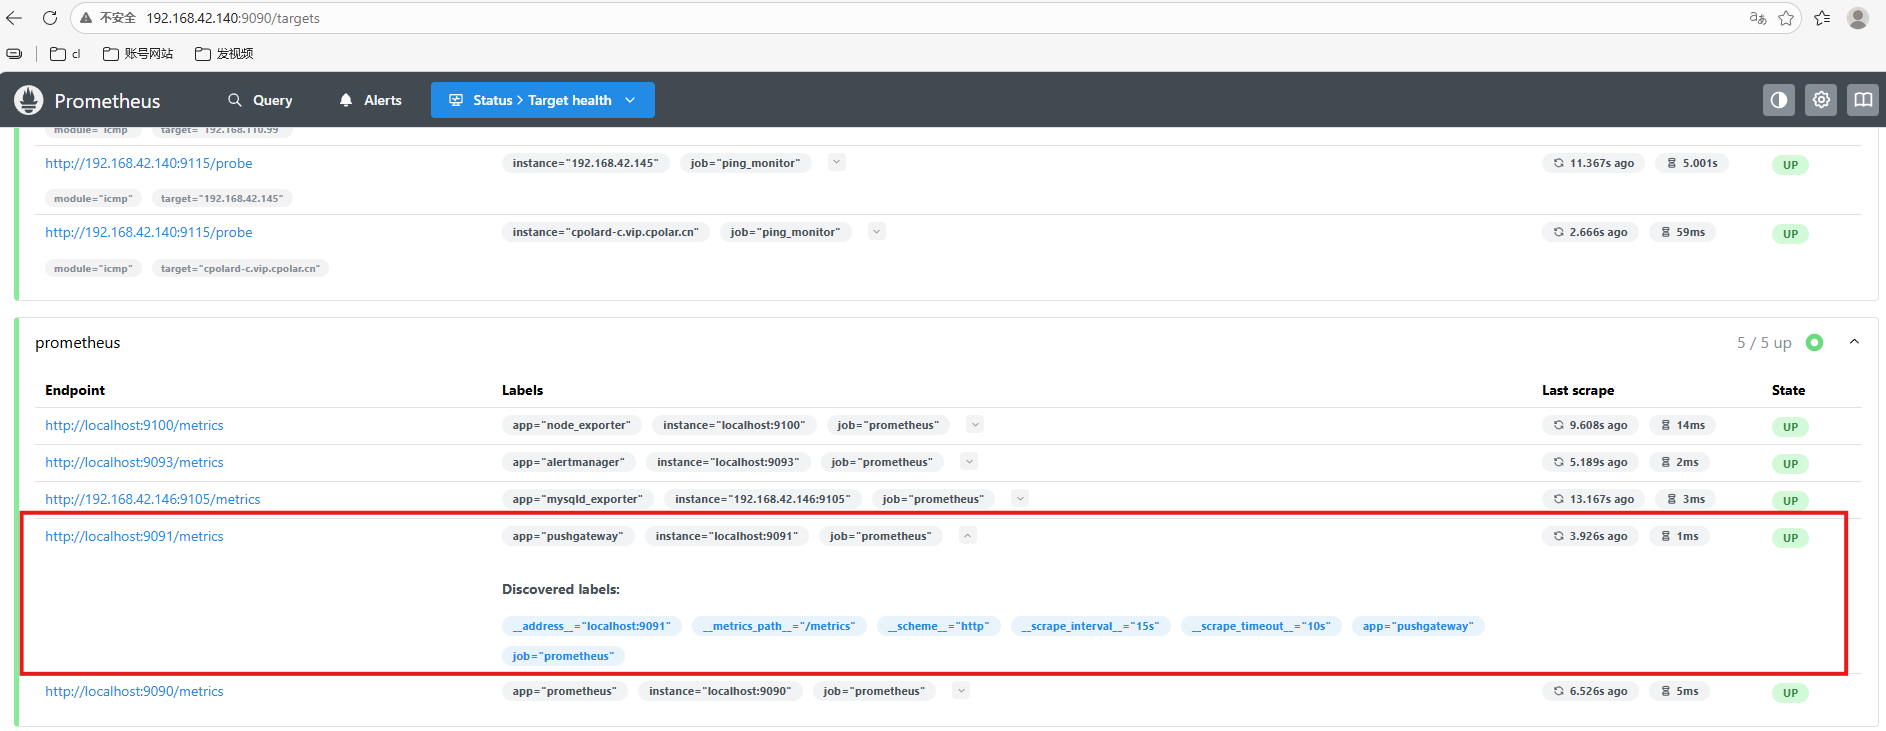 **AI Visual Insight:** This screen shows Pushgateway listed as a Prometheus scrape target with a healthy status, which confirms that the integration is active and business metrics can now enter the time series database. ## The Metric Push API Follows the Prometheus Text Exposition Format Pushgateway uses `/metrics/job/ ` as the default write endpoint, and you can append labels such as `instance` as needed. ### Push a Minimal Metric with curl “`shell # Push a simple gauge metric to test_job echo “test_metric 123456” | \ curl –data-binary @- http://127.0.0.1:9091/metrics/job/test_job “` This command verifies that the Push API works. After execution, the UI will display a `test_job` group. ### Push Metrics with Labels and Type Declarations “`shell cat