[AI Readability Summary]
This article focuses on automating Zabbix 5.0 deployment on CentOS 7 and addresses common challenges such as manual onboarding across multiple nodes, dependency version conflicts, and complex alert pipeline configuration. It covers Zabbix Server, Agent2, MariaDB, PHP SCL, Ansible-based bulk client onboarding, and email/DingTalk alerts. Keywords: Zabbix 5.0, Ansible, monitoring alerts.
The technical specification snapshot highlights the deployment baseline
| Parameter | Value |
|---|---|
| Runtime Environment | CentOS 7 |
| Core Languages | Shell, PHP, SQL |
| Monitoring Protocols | ZBX, SNMP, JMX, IPMI, SMTP, Webhook |
| Zabbix Version | 5.0 |
| Database | MariaDB |
| Web Dependencies | Apache + PHP 7.2 (SCL) |
| Automation Tool | Ansible |
| Typical Ports | Agent 10050 / Server 10051 / Web 80 |
| Reference Popularity | Original article: about 505 views / 12 bookmarks |
| Core Dependencies | zabbix-server-mysql, zabbix-agent2, zabbix-web-mysql-scl, rh-php72 |
This solution fits small to mid-sized Linux monitoring platform deployments
Zabbix is a typical enterprise-grade open source monitoring system. It collects metrics from hosts, networks, applications, and databases, then executes alert actions through triggers. Its core value goes beyond dashboards. It creates a closed loop that connects collection, analysis, storage, and notification.
In this implementation, the Server runs on 192.168.81.133, and the two Clients run on 192.168.81.134 and 192.168.81.135. The focus is not on a one-off single-node installation, but on how to onboard nodes in a repeatable and scalable way.
The core Zabbix workflow can be summarized as a four-stage pipeline
Agent2 collects CPU, memory, disk, network, and process metrics. The Server receives the data, evaluates triggers, and executes actions. MariaDB persists historical data and configuration. The Web frontend handles visualization and administration.
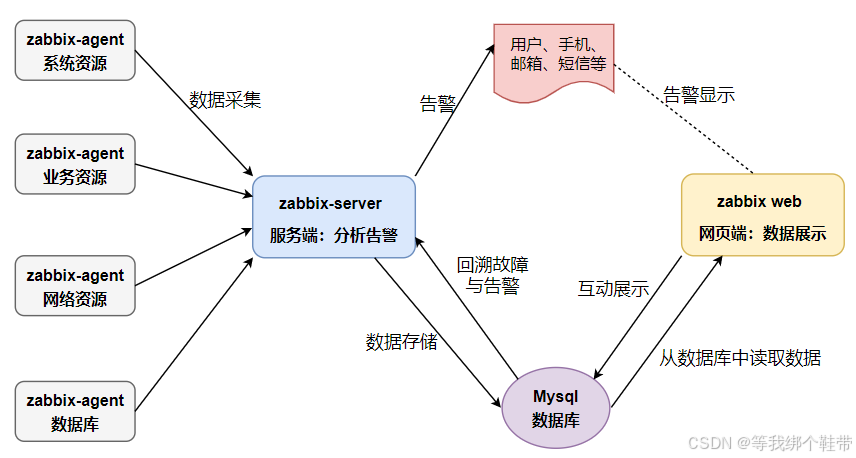 AI Visual Insight: The diagram shows the typical Zabbix data plane: Agent collects metrics from monitored hosts and sends them to the Server, the Server writes monitoring values and trigger evaluation results into the database, and the Web frontend reads from the database for visualization and configuration management. This reflects a layered architecture for collection, computation, storage, and presentation.
# Verify from the server whether the agent is reachable
zabbix_get -s '192.168.81.134' -p 10050 -k 'agent.ping'   # Check whether the agent is alive
zabbix_get -s '192.168.81.134' -p 10050 -k 'system.hostname' # Get the monitored host name
These commands quickly validate Agent2 connectivity and confirm that basic monitoring items are working.
Three monitoring architectures map to different scales and network boundaries
The most basic model is server-client, which fits a small number of hosts inside a local network. It has fewer nodes, shorter paths, and a smaller failure surface, but it does not scale well across data centers or under large concurrent collection workloads.
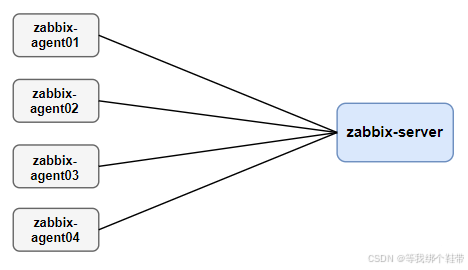 AI Visual Insight: The diagram shows direct communication between the Server and Clients with no proxy layer in between. This means both collection and control flows are centralized on the core node, which suits simple, low-latency environments with a limited number of hosts.
Mid-sized environments often use server-proxy-client. The Proxy acts as an intermediate layer that buffers collected data, reduces pressure on the main Server, and works better across network boundaries.
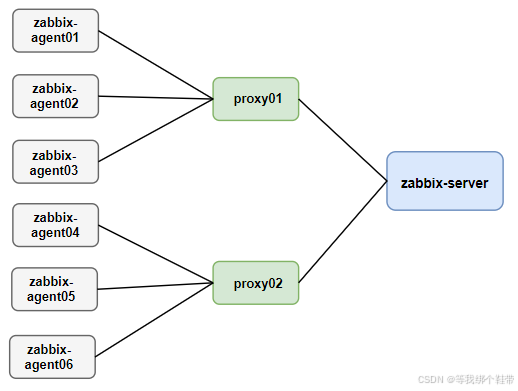 AI Visual Insight: This diagram emphasizes that the Proxy sits between the Server and multiple Clients, where it handles buffering, forwarding, and poll offloading. That makes it suitable for distributed data centers or environments with a steadily growing node count.
Large-scale environments can adopt master-node-client. A Node has its own configuration and database capabilities, which makes it suitable for cross-region monitoring, but it also introduces the highest operational complexity and is usually reserved for large distributed organizations.
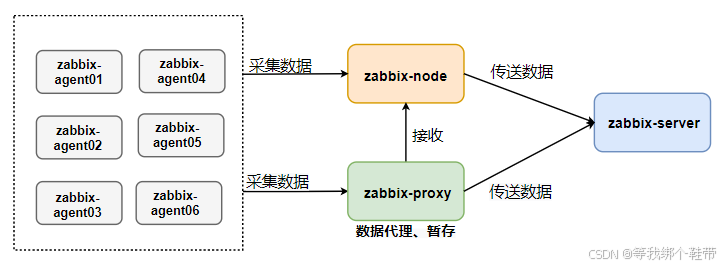 AI Visual Insight: The diagram shows multiple Nodes under a Master, and each Node connects to Proxies or Clients. This reflects a hierarchical design with synchronized configuration and regional autonomy, aimed at improving cross-data-center resilience and horizontal scalability.
The key challenge in server installation lies in dependency chains rather than commands
CentOS 7 ships with an older PHP version by default, while the Zabbix 5.0 frontend requires at least PHP 7.2. This deployment uses SCL to install rh-php72, which avoids breaking system-provided dependencies.
In addition, database initialization requires careful handling of character sets and InnoDB index limits. The original implementation already verified that on older MariaDB 5.5/10.x environments, blindly using utf8mb4 can easily trigger index length errors. In this scenario, utf8 + utf8_bin is a safer choice.
# Install Zabbix server and frontend dependencies
yum -y install zabbix-agent2 zabbix-get zabbix-sender \
               zabbix-server-mysql zabbix-web zabbix-web-mysql

# Install MariaDB
yum install -y mariadb-server mariadb
systemctl enable --now mariadb   # Start MariaDB and enable it at boot
This command set installs the baseline components for Zabbix Server, the Web frontend, and the database.
Database initialization must explicitly define the character set strategy
When you create the database, use utf8 and utf8_bin from the start to avoid index mismatches when importing create.sql later. Then set the database password in zabbix_server.conf so that the Server can start successfully.
CREATE DATABASE zabbix CHARACTER SET utf8 COLLATE utf8_bin; -- Create the monitoring database
CREATE USER 'zabbix'@'localhost' IDENTIFIED BY 'your_password'; -- Create a dedicated account
GRANT ALL PRIVILEGES ON zabbix.* TO 'zabbix'@'localhost'; -- Grant privileges
FLUSH PRIVILEGES; -- Reload privileges
This SQL creates a minimal but functional Zabbix database and privilege model.
The best practice for client onboarding is to use Agent2 with template-driven management
Agent2 is the recommended component in Zabbix 5.0. It provides better performance and stronger extensibility. The three most important client-side settings are Server, ServerActive, and Hostname. The first two control passive and active communication paths, and the last one must match the host definition in the frontend.
# /etc/zabbix/zabbix_agent2.conf
Server=192.168.81.133          # Allow this server to pull data in passive mode
ServerActive=192.168.81.133    # Target server for active reporting
Hostname=k8s-node1             # Must match the registered host name in the frontend
This configuration defines the trust relationship between Agent2 and the Server, as well as the host identity.
After you add the host in the Web frontend, bind a Linux template to quickly get CPU, memory, disk, and network graphs. The template mechanism is what makes Zabbix scalable. Avoid creating monitoring items manually one by one.
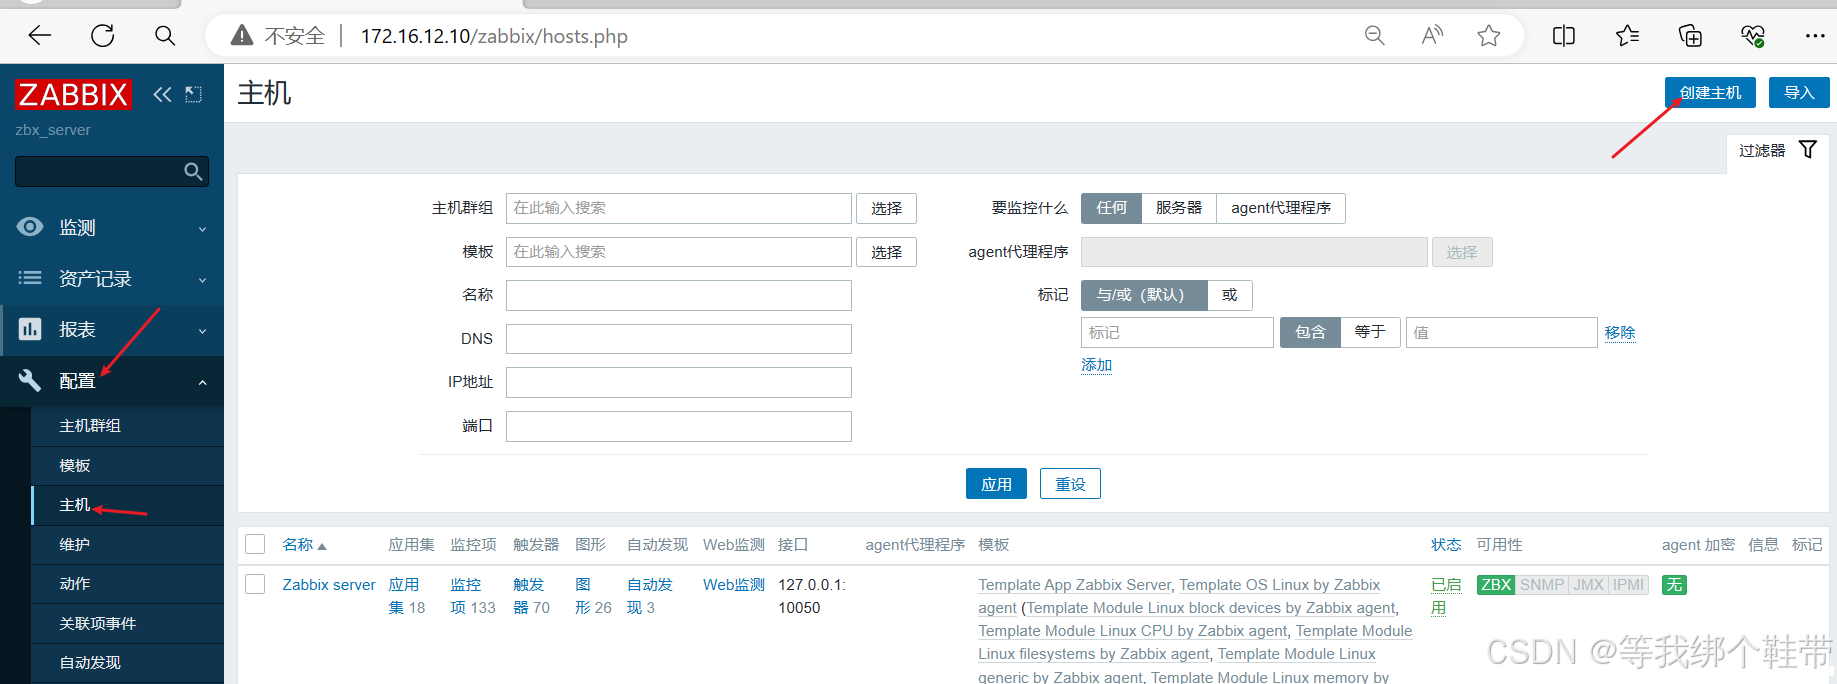 AI Visual Insight: The image shows the entry point for adding a monitored host in the Web console, highlighting that host name, visible name, interface configuration, and template binding are the core metadata in the onboarding workflow.
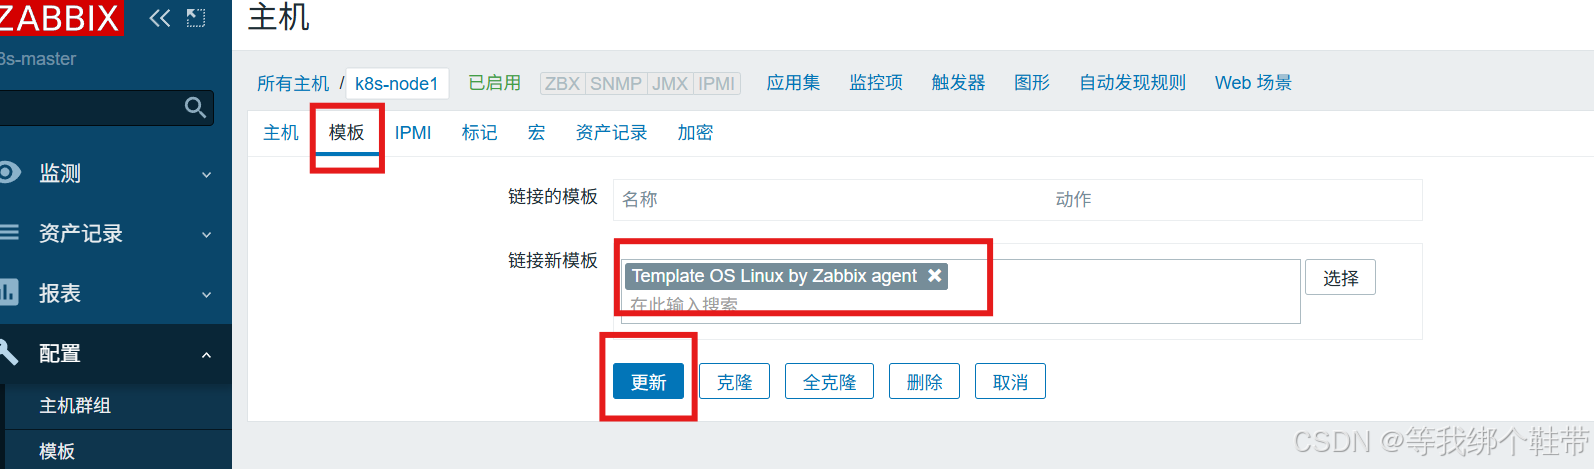 AI Visual Insight: This screen focuses on the template selection area, showing how Zabbix uses templates to attach items, triggers, graphs, and discovery rules to hosts in bulk, which significantly reduces repeated configuration work.
Ansible-based bulk deployment significantly reduces multi-node onboarding cost
As the number of Client nodes grows, installing Agent2 host by host quickly becomes unmanageable. A more efficient approach is to configure passwordless SSH from the Server first, then use Ansible’s script module to distribute and execute a deployment script in bulk.
# /etc/ansible/hosts
[zabbix_servers]
192.168.81.134
192.168.81.135

ansible zabbix_servers -m ping   # Verify bulk connectivity
This configuration defines the managed node inventory and validates control-plane connectivity.
The core logic of the original script is to install the Alibaba Cloud Zabbix repository, deploy zabbix-agent2, replace configuration values, and start the service. This design is more stable than stacking a long list of ad-hoc commands, and it is easier to version and maintain later.
#!/bin/bash
ZABBIX_SERVER_IP="192.168.81.133"                  # Specify the server address
CONF_FILE="/etc/zabbix/zabbix_agent2.conf"
CURRENT_HOSTNAME=$(hostname)                        # Read the current host name automatically

yum install -y zabbix-agent2                        # Install Agent2
sed -i "s/^Server=127.0.0.1/Server=${ZABBIX_SERVER_IP}/" $CONF_FILE
sed -i "s/^ServerActive=127.0.0.1/ServerActive=${ZABBIX_SERVER_IP}/" $CONF_FILE
sed -i "s/^Hostname=Zabbix server/Hostname=${CURRENT_HOSTNAME}/" $CONF_FILE
systemctl enable --now zabbix-agent2               # Start the service and enable it at boot
This script implements a minimal closed loop for automated Agent2 deployment.
The value of the alert pipeline lies in turning monitoring results into executable actions
Zabbix supports multiple media types, including QQ Mail and DingTalk Webhooks. Email works well for standardized notifications, while DingTalk is better for real-time team collaboration. In practice, configuration has three steps: create the media type, bind the media to a user, and create an Action with trigger conditions.
For QQ Mail, the key step is to enable SMTP and generate an authorization code. For DingTalk, you need a bot Webhook, and if signature verification is enabled, you must also provide the Secret. In real deployments, success usually depends less on media creation itself and more on whether the Action conditions match the user-media bindings.
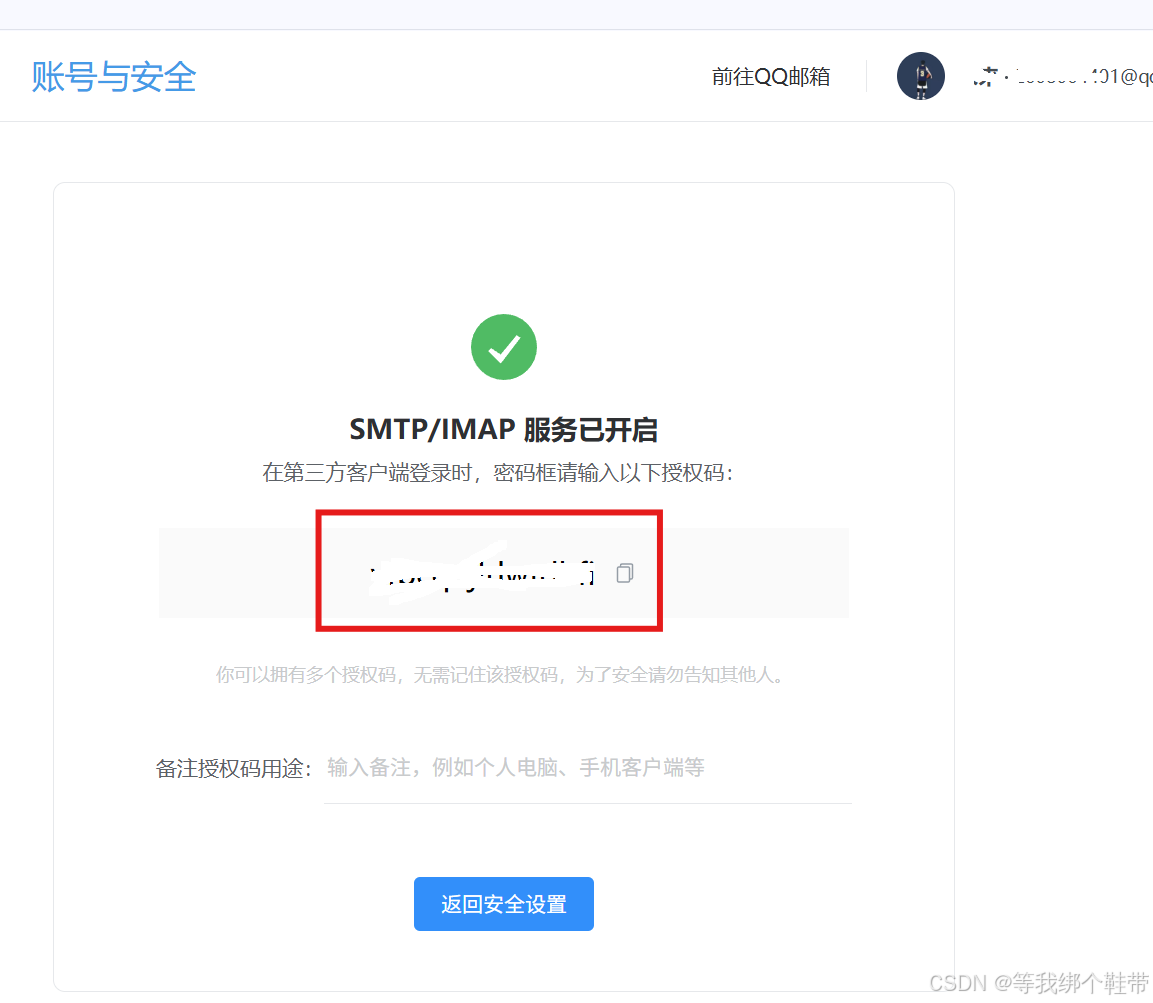 AI Visual Insight: The image shows the QQ Mail backend with SMTP/POP3 toggles and the authorization code entry point. This indicates that Zabbix does not authenticate with the mailbox password directly, but instead uses an application-specific authorization code.
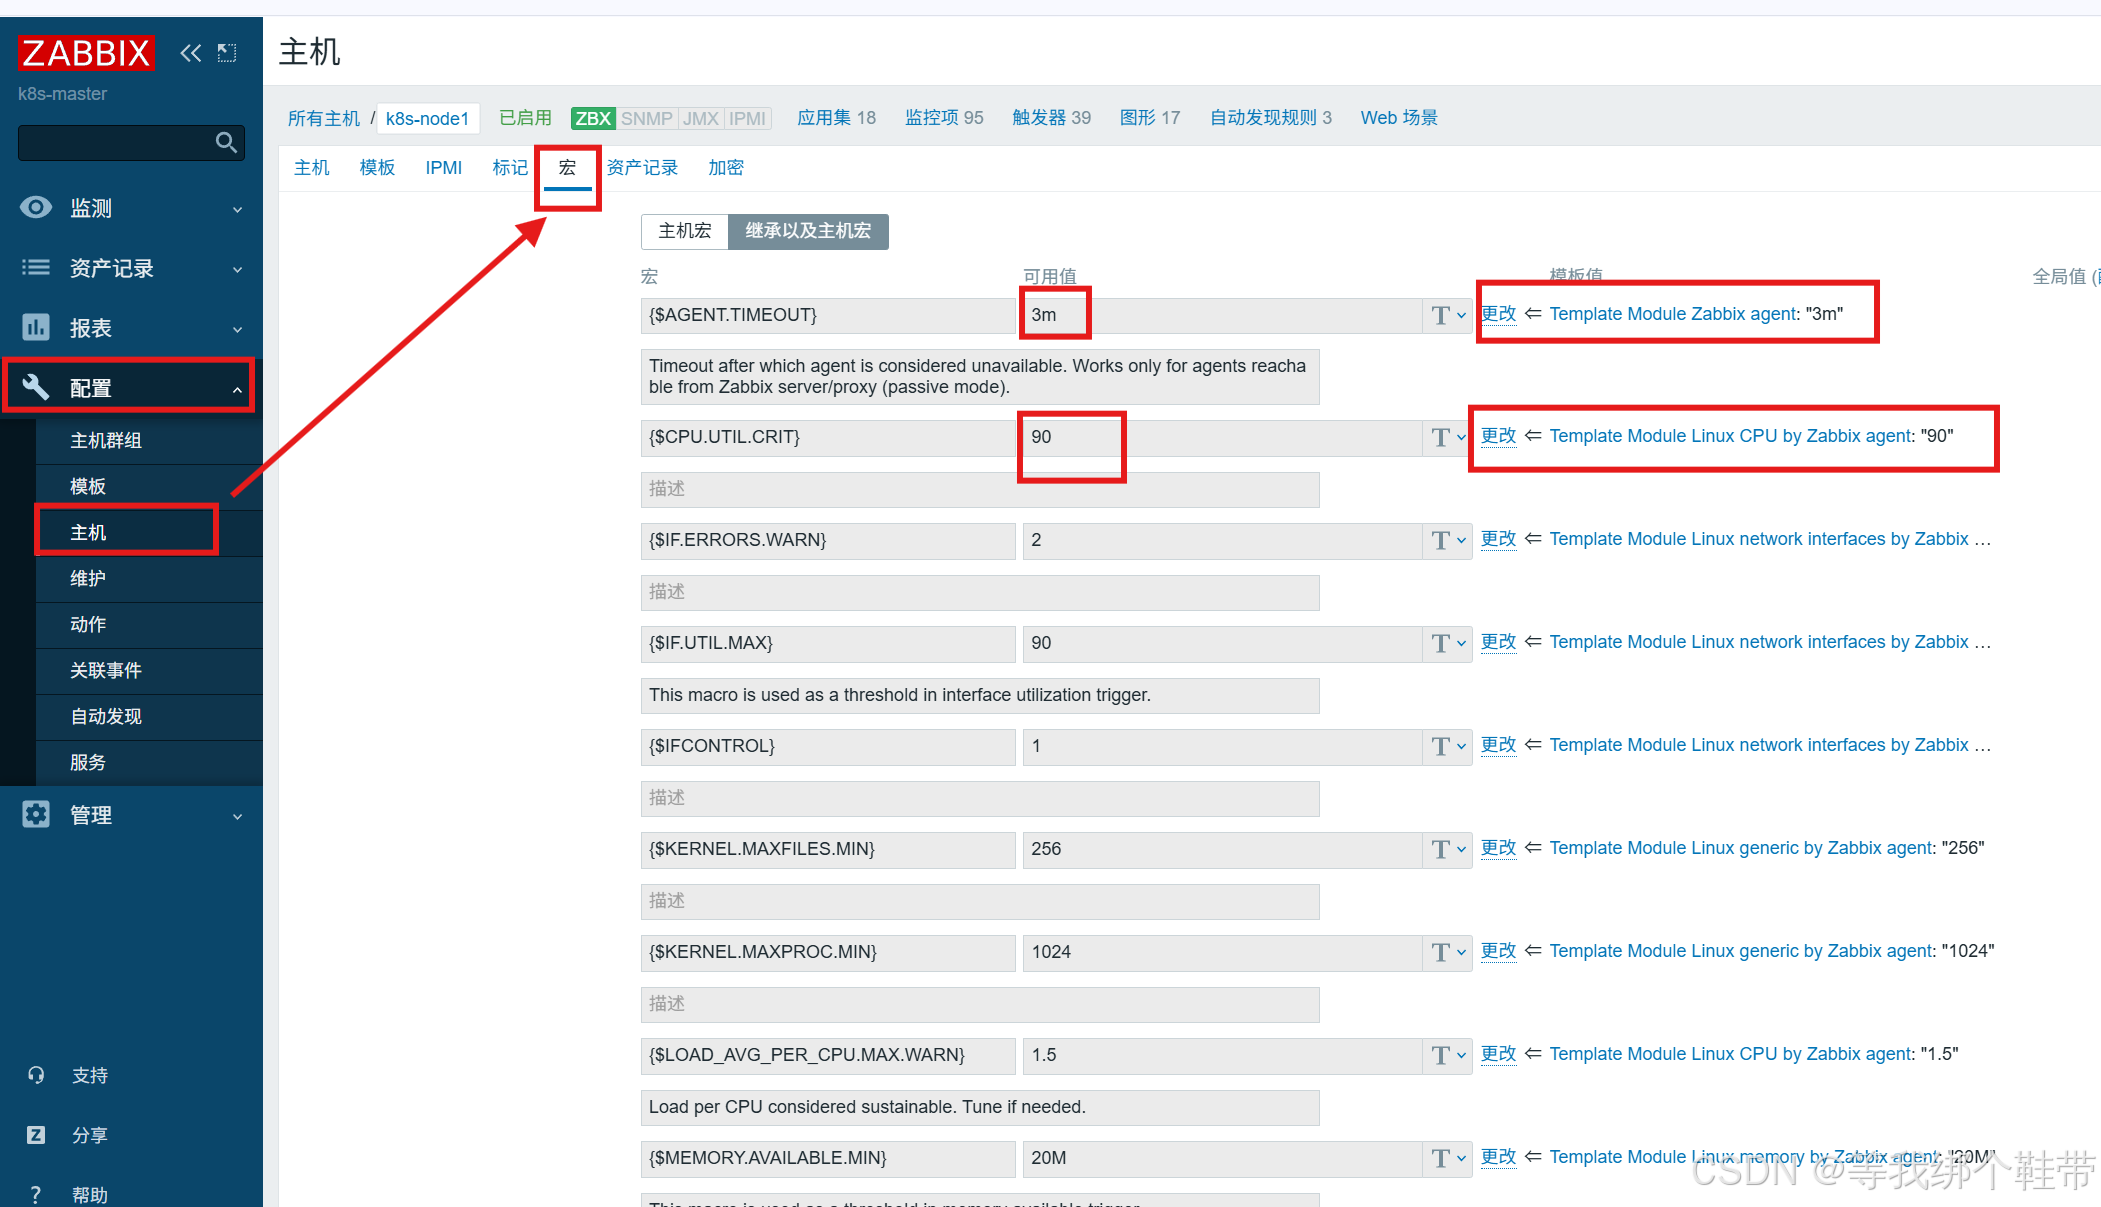 AI Visual Insight: This interface shows where trigger expressions or thresholds can be adjusted, indicating that alert sensitivity should be tuned based on business workload characteristics rather than left at default template thresholds.
# Alert test: stop agent2 on the client
systemctl stop zabbix-agent2   # Intentionally trigger a fault to validate the action pipeline
Use this step to verify that the full path from trigger to action to email/DingTalk has been connected successfully.
The agent model determines what types of targets you can monitor
ZBX is best for deep host-level metrics. SNMP fits network devices such as switches and routers. JMX targets JVM applications. IPMI focuses on hardware health. These protocols are not mutually exclusive. Together, they form multiple collection entry points into a unified observability surface.
For routine server monitoring on CentOS 7, Agent2 remains the first choice. If you need to manage network devices, add SNMP. If you need JVM heap and thread metrics for Java services, enable JMX. Choose the collection protocol based on the target type instead of forcing a one-size-fits-all standard.
FAQ
Q1: Why do I need to install PHP SCL separately for Zabbix 5.0 on CentOS 7?
A: Because the default PHP version on CentOS 7 is usually too old to satisfy the Zabbix 5.0 frontend requirements. Using rh-php72 provides a compatible runtime without breaking the system default PHP.
Q2: Why is utf8 recommended instead of utf8mb4 when importing the Zabbix database?
A: On older MariaDB versions or compatibility configurations, utf8mb4 is more likely to hit index length limits. The original implementation verified that utf8 + utf8_bin is more stable for this deployment scenario.
Q3: For bulk Agent2 deployment, should I run Ansible commands directly or distribute a script?
A: Direct commands work for a small number of simple steps. But if the workflow includes repository setup, configuration replacement, and service startup, distributing a script is easier to maintain, reuse, and troubleshoot across multiple nodes.
Core takeaway: This article reconstructs a complete Zabbix 5.0 deployment workflow on CentOS 7, covering Server and Agent2 architecture, MariaDB and PHP 7.2 dependency handling, Ansible-based bulk client deployment, and QQ Mail plus DingTalk alert configuration. It is well suited for quickly building a small to mid-sized operations monitoring platform.