This article breaks down a township visualization project built with Spring Boot, Leaflet, and PostGIS. Its core capabilities include township spatial data storage, GeoJSON API output, and interactive map rendering. The solution addresses a common challenge in grassroots governance and regional analysis: tabular data is hard to interpret visually, and spatial relationships are difficult to express. Keywords: Spring Boot, Leaflet, PostGIS.
Technical specifications provide a quick implementation snapshot
| Parameter | Description |
|---|---|
| Backend language | Java |
| Frontend mapping library | Leaflet 1.9.2 |
| Backend framework | Spring Boot 2.7.x |
| Spatial database | PostgreSQL + PostGIS |
| Data exchange protocol | HTTP/REST, GeoJSON |
| ORM/persistence layer | MyBatis-Plus |
| JDBC dependency | postgis-jdbc 2.5.0 |
| GitHub stars | Not provided in the source |
| Core scenarios | County search, township search, full dataset rendering |
This project demonstrates a practical low-barrier path to township-level WebGIS
The project uses a classic combination: Spring Boot serves APIs, Leaflet handles rendering, and PostGIS manages spatial data. It does not aim to replicate a heavyweight GIS platform. Instead, it focuses on fast delivery, a clear architecture, and easy extensibility.
When working with township-level administrative units, traditional tables struggle to communicate distribution density, jurisdictional relationships, and regional differences. A map-based presentation directly supports use cases such as grassroots governance, regional planning, and hometown lookup.
 AI Visual Insight: The image shows the project’s map-based overview interface. Key information includes the spatial distribution of townships across Hunan Province, aggregated administrative-unit presentation, and a frontend visual analysis entry point built on top of a basemap. It highlights Leaflet’s effectiveness in lightweight administrative division visualization.
The value of the system lies in data accessibility, not visual gimmicks
For this type of system, the most important outcome is not 3D effects. It is the ability to place township names, administrative codes, spatial extents, and statistical results on a single map. For governments, researchers, and general users, this is far more readable and actionable than isolated data tables.
CREATE TABLE public.biz_hn_town (
  gid int4 PRIMARY KEY,
  gml_id varchar(80),
  name varchar(80),
  layer varchar(80),
  code varchar(80),
  grade int4,
  geom geometry -- Core spatial field that stores township geometry objects
);

CREATE INDEX biz_hn_town_geom_idx
ON public.biz_hn_town
USING gist (geom); -- Use a GiST index to improve spatial query performance
This SQL defines the minimum viable schema for a township spatial table. The key elements are the geometry field and the GiST spatial index.
The data model must serve both retrieval and rendering
In the original design, the biz_hn_town table preserves fields for name, code, level, and geom, which already satisfies most administrative boundary visualization requirements. If you later need heatmaps, thematic maps, or multidimensional analysis, you can extend the schema with attributes such as population, area, and industry.
More importantly, the retrieval strategy matters. The project abstracts its APIs into three categories: query by county code, fuzzy search by name, and full dataset fetch. These correspond to local drill-down, interactive search, and map initialization, covering the main workflow of a basic WebGIS application.
Backend API design directly determines frontend interaction quality
At the Mapper layer, st_asgeojson(geom) converts spatial fields directly into GeoJSON strings, which reduces frontend post-processing overhead. This is a highly practical pattern for lightweight GIS projects.
@Select("select t.*, st_asgeojson(geom) as geomJson " +
        "from biz_hn_town t where starts_with(t.code, #{code}) order by t.code")
List
<HnTown> findListByCode(@Param("code") String code);

@Select("select st_asgeojson(geom) as geomJson from biz_hn_town where gid = #{gid}")
HnTown findGeoJsonById(@Param("gid") Long gid);
This code converts PostGIS geometry objects directly into GeoJSON text that the frontend can consume immediately.
The Spring Boot backend emphasizes simplicity, stability, and extensibility
The HnTown entity uses MyBatis-Plus annotations for table mapping and a custom PgGeometryTypeHandler to process spatial fields. This approach preserves native geometry capabilities in the database while also exposing a geomJson field for JSON output.
The Controller layer exposes a county map page, data list APIs, paginated queries, and GeoJSON detail endpoints. In essence, it splits township visualization into two service categories: list capabilities and spatial capabilities. The separation of responsibilities is clear and maintainable.
@GetMapping("/datalist/{areaCode}")
@ResponseBody
public AjaxResult dataList(@PathVariable String areaCode) {
    List
<HnTown> list = hnTownService.selectByAreaCode(areaCode); // Query the township collection by county code
    return AjaxResult.success().put("data", list); // Return a unified data structure that the frontend can consume directly
}
This Controller code encapsulates the most common map data loading endpoint.
Using Leaflet for the presentation layer is a high-value engineering choice
Leaflet’s strengths are its lightweight footprint, mature ecosystem, and excellent GeoJSON support. For township-level projects, you usually do not need advanced 3D capabilities. What you need is layer loading, popups, zooming, highlighting, and filtering, and Leaflet handles all of these well.
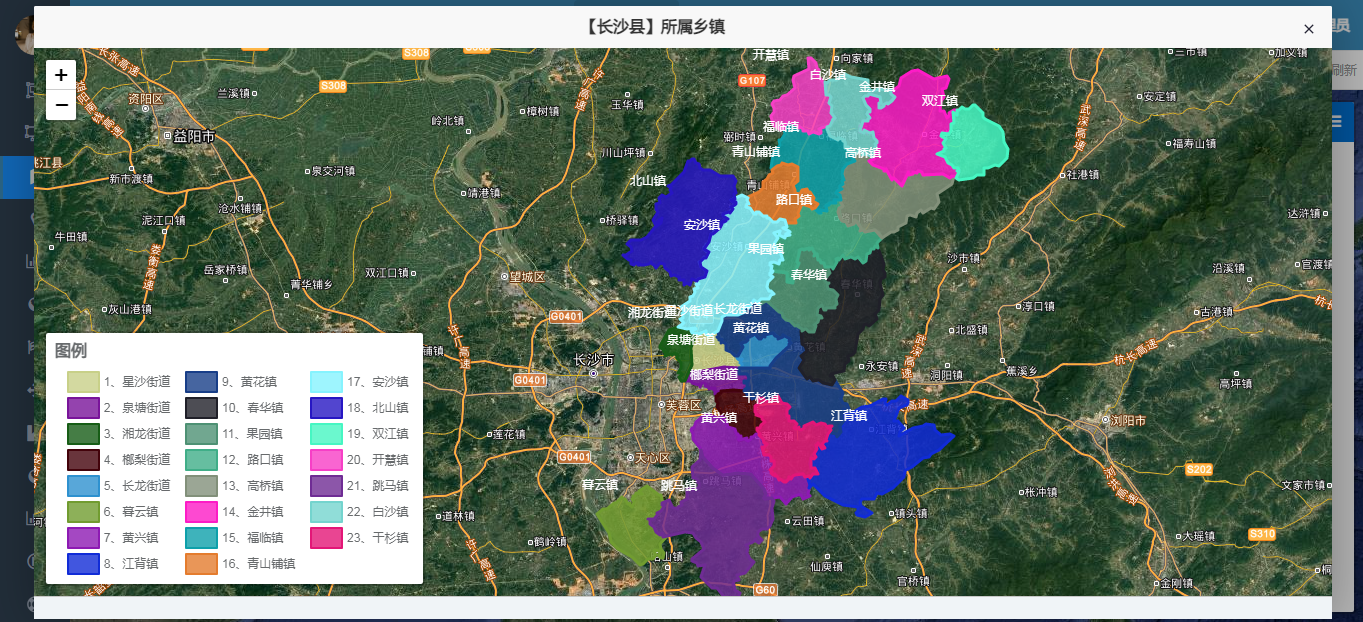
The project results demonstrate this clearly. Whether the view shows the county with the most townships, the county with the fewest townships, a user’s hometown township, or the townships under Changsha County, they all rely on the same underlying administrative retrieval and map highlighting mechanism.
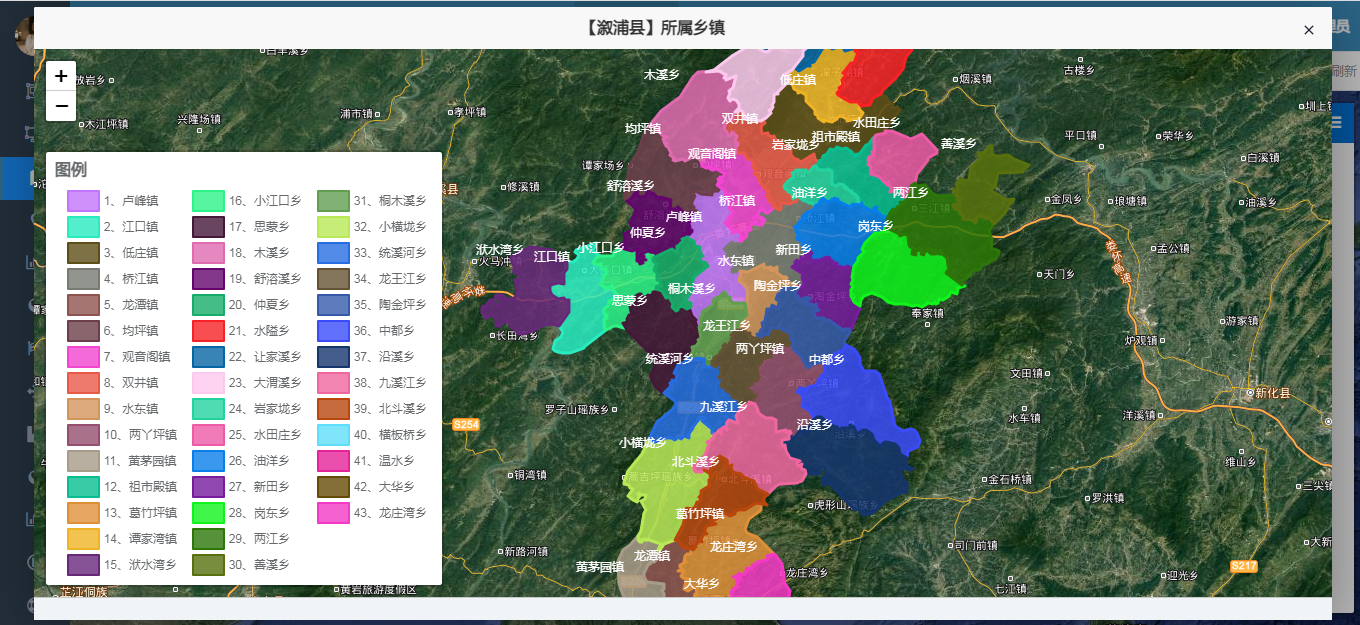 AI Visual Insight: The image shows a dense township distribution within a specific county. Multiple township objects are rendered together on the map, making it suitable for observing township count, relative position, and local clustering patterns. It serves as intuitive evidence for administrative density analysis.
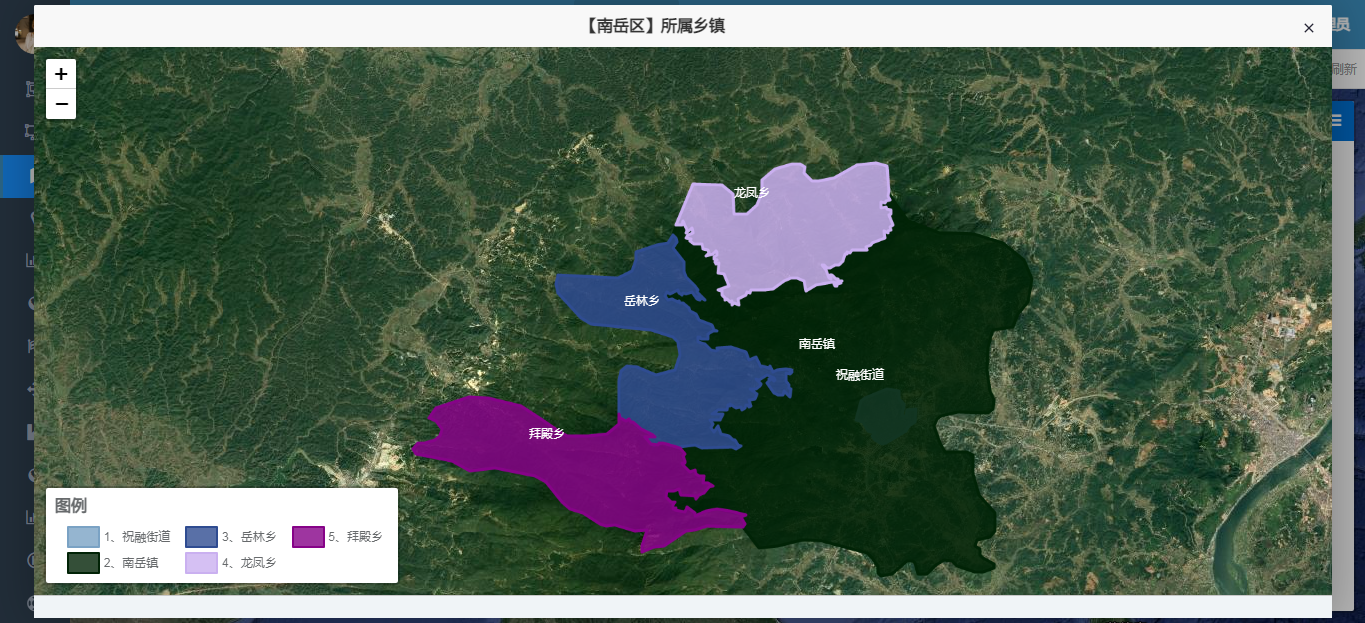 AI Visual Insight: The image shows the map effect for a county with fewer townships. Spatial objects appear sparse, and boundary relationships are easier to distinguish. This makes it useful for comparing differences in administrative unit count and spatial organization across counties.
Statistical queries turn a map from a display tool into an analysis tool
The article includes an SQL query that computes the top three counties in Hunan Province by township count. This step is essential. A map becomes analytically useful only when it combines spatial objects with statistical indicators.
SELECT t2.area_code,
       MAX(t2.area_name) AS area_name,
       COUNT(1) AS town_count
FROM biz_hn_town t1, biz_area t2
WHERE starts_with(t1.code, t2.area_code)
  AND t2.province_code = '430000' -- Count only records in Hunan Province
GROUP BY t2.area_code
ORDER BY town_count DESC
LIMIT 3; -- Extract the top three counties by township count
This SQL outputs the ranking of counties in Hunan Province with the highest number of townships.
The extension path for this solution is already clear
First, you can upgrade point-style displays to full administrative boundary polygon rendering to strengthen spatial expression. Second, you can overlay bar charts, heatmaps, and thematic maps to improve analytical depth. Third, you can introduce zoom-level-based progressive loading to avoid the performance pressure caused by full dataset rendering.
If you want to productionize the system, add a caching layer, compressed GeoJSON transport, a unified dictionary coding system, and frontend layer management. These improvements can move the system from a demo-grade project to an operational business platform.
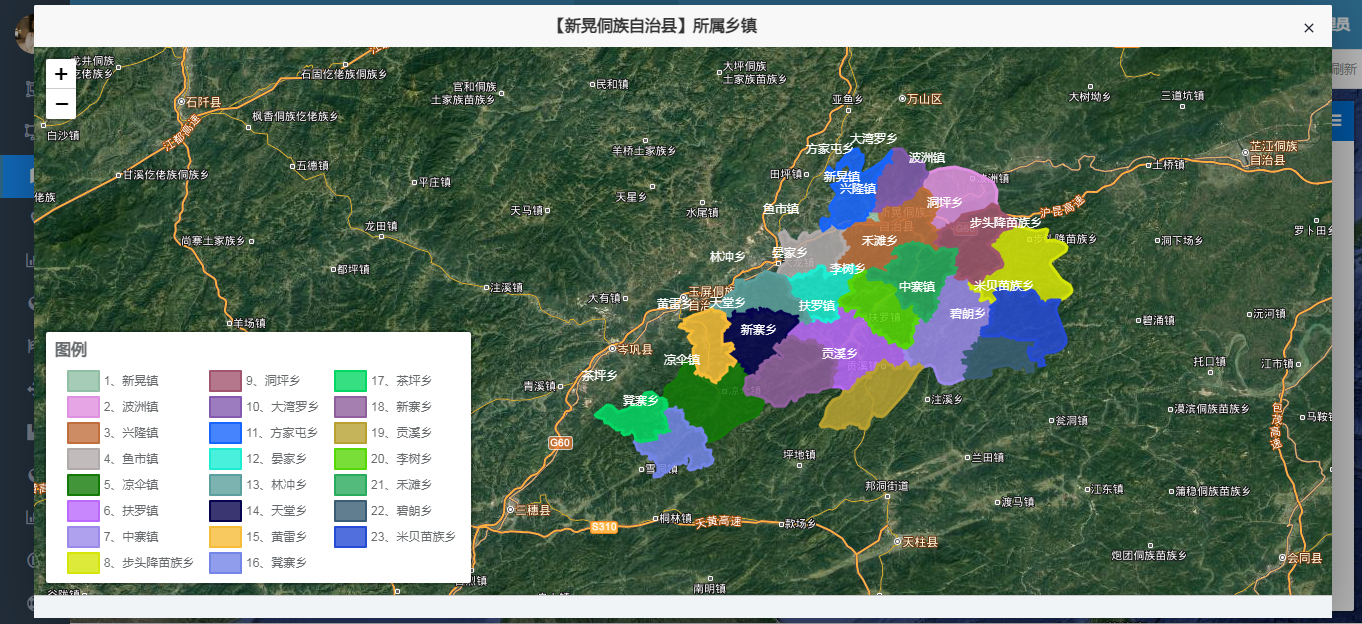 AI Visual Insight: The image focuses on the “hometown township” query scenario and shows localized spatial results after searching by name or county. It demonstrates that the system supports not only macro-level statistics but also fine-grained retrieval and affiliation lookup for individual users.
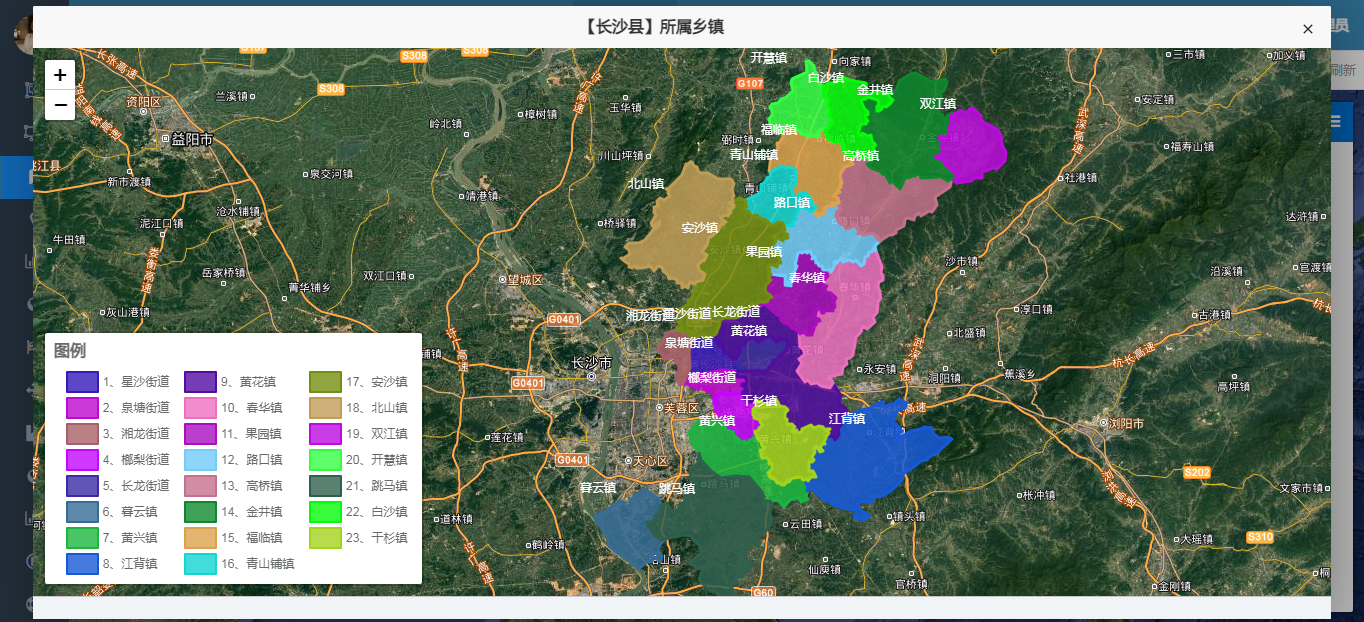 AI Visual Insight: The image shows the township distribution result for Changsha County. It reflects the organizational structure of township objects within a specific county and can support research on top-ranked counties, public facility planning, and territorial governance analysis.
FAQ provides structured answers to common implementation questions
Why does this project choose Leaflet instead of a heavier GIS framework?
Leaflet offers direct GeoJSON support, a small footprint, and a low learning curve, which makes it ideal for township-level administrative division visualization. If your requirements focus on 2D retrieval, popups, and highlighting, it is more efficient than a heavyweight framework.
What is the core role of PostGIS in this solution?
PostGIS provides geometry storage, spatial indexing, and st_asgeojson conversion. Without it, you cannot manage spatial fields efficiently, and data exchange between the backend and frontend becomes much more cumbersome.
How can you extend this example into a production-grade WebGIS?
Start by adding polygon boundary data, caching, access control, and progressive loading. Then introduce layer management, thematic statistics, and a data update workflow. After that, you can consider more advanced spatial analysis capabilities.
Core summary captures the implementation pattern
This article reconstructs a township-level visualization solution based on Spring Boot, Leaflet, and PostGIS. It focuses on Hunan administrative division data visualization, GeoJSON output, county-level retrieval, and statistical analysis, making it well suited for Java developers who want to build lightweight WebGIS applications quickly.