This article explains how to connect Spring Boot and Logback directly to Kafka, then use Logstash to write logs into Elasticsearch and search them in Kibana to build a real-time log collection pipeline. It addresses fragmented logs across distributed systems, slow troubleshooting, and weak search capabilities. Keywords: ELK, Kafka, Spring Boot.
Technical Specifications Snapshot
| Parameter | Details |
|---|---|
| Primary Languages | Java, XML, YAML, Bash |
| Log Pipeline Protocols | Kafka TCP protocol, Elasticsearch REST API |
| Original Popularity | 308 views, 9 likes, 7 bookmarks |
| Core Dependencies | Spring Boot, logback-kafka-appender, Logstash, Elasticsearch, Kibana |
| Recommended Versions | Elasticsearch 9.3.2, Kibana 9.3.2, Logstash 9.3.2, Kafka 3.5.0 |
This architecture is well-suited for distributed log collection challenges
After microservices are deployed, logs become scattered across multiple machines and instances. Traditional troubleshooting through SSH login and grep is expensive and makes unified search, alerting, and replay difficult.
This architecture first writes application logs asynchronously to Kafka, then lets Logstash consume them and store structured records in Elasticsearch. Finally, Kibana provides near real-time search and visualization. The core value lies in decoupling, traffic smoothing, and stronger observability.
The smallest complete logging loop looks like this
Spring Boot application
  -> Logback outputs JSON logs
  -> Kafka topic: app-logs
  -> Logstash consumes and cleans fields
  -> Elasticsearch indexes logs by level
  -> Kibana Discover searches and analyzes logs
This flow defines the full data path from log production to retrieval.
Component version alignment determines system stability
You should keep Elastic Stack components on the same version to avoid compatibility issues involving field templates, APIs, or plugins. Kafka can be upgraded independently, but you must verify compatibility with the Logstash Kafka input plugin.
Use the following baseline: Elasticsearch, Kibana, and Logstash on 9.3.2; Kafka on 3.5.0; Zookeeper on 3.8.0; and Spring Boot on 3.5.13.
A recommended port plan makes troubleshooting easier
# Default ports for core services
Elasticsearch: 9200
Kibana: 5601
Logstash API: 9600
Kafka: 9092
Zookeeper: 2181
Spring Boot: 8080
This port set is the first connectivity baseline to check during integration testing.
Service startup order should follow dependency relationships
Start Elasticsearch and Kafka first, then Kibana and Logstash, and finally Spring Boot. This order reduces idle consumers and prevents initial send failures on the application side.
You can reuse these basic startup commands directly
# Elasticsearch
./elasticsearch -d

# Zookeeper
bin/zookeeper-server-start.sh -daemon config/zookeeper.properties

# Kafka
bin/kafka-server-start.sh -daemon config/server.properties

# Logstash
bin/logstash -f config/logstash-kafka.conf
These commands bring up the minimum set of logging infrastructure services.
The key on the Spring Boot side is letting Logback emit structured JSON directly
The application only needs to log normally. The actual collection work is handled by the Logback Kafka Appender. This keeps business code unaware of Elasticsearch or Logstash and minimizes architectural coupling.
In pom.xml, add logback-kafka-appender in addition to spring-boot-starter. If the dependency cannot be downloaded from the central repository, try switching to 0.2.0-RC2 or install it manually into your local repository.
application.yml declares the Kafka connection parameters
spring:
  kafka:
    bootstrap-servers: 192.168.194.147:9092  # Kafka broker address
    producer:
      key-serializer: org.apache.kafka.common.serialization.StringSerializer
      value-serializer: org.apache.kafka.common.serialization.StringSerializer
This configuration tells the Spring application how to access the Kafka broker.
logback-spring.xml defines the log format and destination
<appender name="KAFKA" class="com.github.danielwegener.logback.kafka.KafkaAppender">
    <encoder class="ch.qos.logback.classic.encoder.PatternLayoutEncoder">

<pattern>{"timestamp":"%d{yyyy-MM-dd'T'HH:mm:ss.SSSZZ}","level":"%level","thread":"%thread","logger":"%logger","message":"%msg","exception":"%ex{short}"}%n</pattern>
    </encoder>

<topic>app-logs</topic>

<producerConfig>bootstrap.servers=192.168.194.147:9092</producerConfig>

<producerConfig>linger.ms=100</producerConfig>
</appender>
This configuration encodes standard log events as JSON and pushes them asynchronously to the app-logs topic.
You must explicitly prevent Kafka client log recursion
This is the easiest pitfall in the entire setup. During initialization, the Kafka client also writes logs. If those logs are sent back into the Kafka Appender again, they create recursive calls and eventually trigger a StackOverflowError.
The correct approach is isolating org.apache.kafka logs separately
<logger name="org.apache.kafka" level="WARN" additivity="false">
    <appender-ref ref="CONSOLE"/>
</logger>
This configuration blocks Kafka’s own logs from being written back into Kafka again.
Logstash handles consumption, field cleanup, and routing into Elasticsearch
After Logstash reads JSON logs from the app-logs topic, it can map the business timestamp to @timestamp and route records into different indices by level. This makes Kibana searches clearer and makes error logs more suitable for dedicated alerting.
Here is a practical Logstash configuration
input {
  kafka {
    bootstrap_servers => "192.168.194.147:9092"  # Kafka broker address
    topics => ["app-logs"]
    group_id => "logstash-group"
    codec => "json"  # Decode messages as JSON
  }
}
filter {
  if [timestamp] {
    date {
      match => ["timestamp", "ISO8601"]  # Map business timestamp
      target => "@timestamp"
    }
  }
}
output {
  if [level] == "ERROR" {
    elasticsearch { index => "app-logs-error-%{+YYYY.MM.dd}" }
  } else {
    elasticsearch { index => "app-logs-info-%{+YYYY.MM.dd}" }
  }
}
This configuration completes three key actions: consumption, timestamp normalization, and level-based indexing.
Kibana turns raw logs into searchable assets
Once app-logs-info-* and app-logs-error-* indices appear in Elasticsearch, you only need to create a Data View in Kibana. Then you can search by time, level, thread, or keyword in Discover.
 AI Visual Insight: This screenshot shows the entry point for creating a data view in Kibana based on an index pattern. The key detail is that you must bind
 app-logs-info-* or app-logs-error-* to the @timestamp time field, which is required for time-based filtering and sorting in Discover.
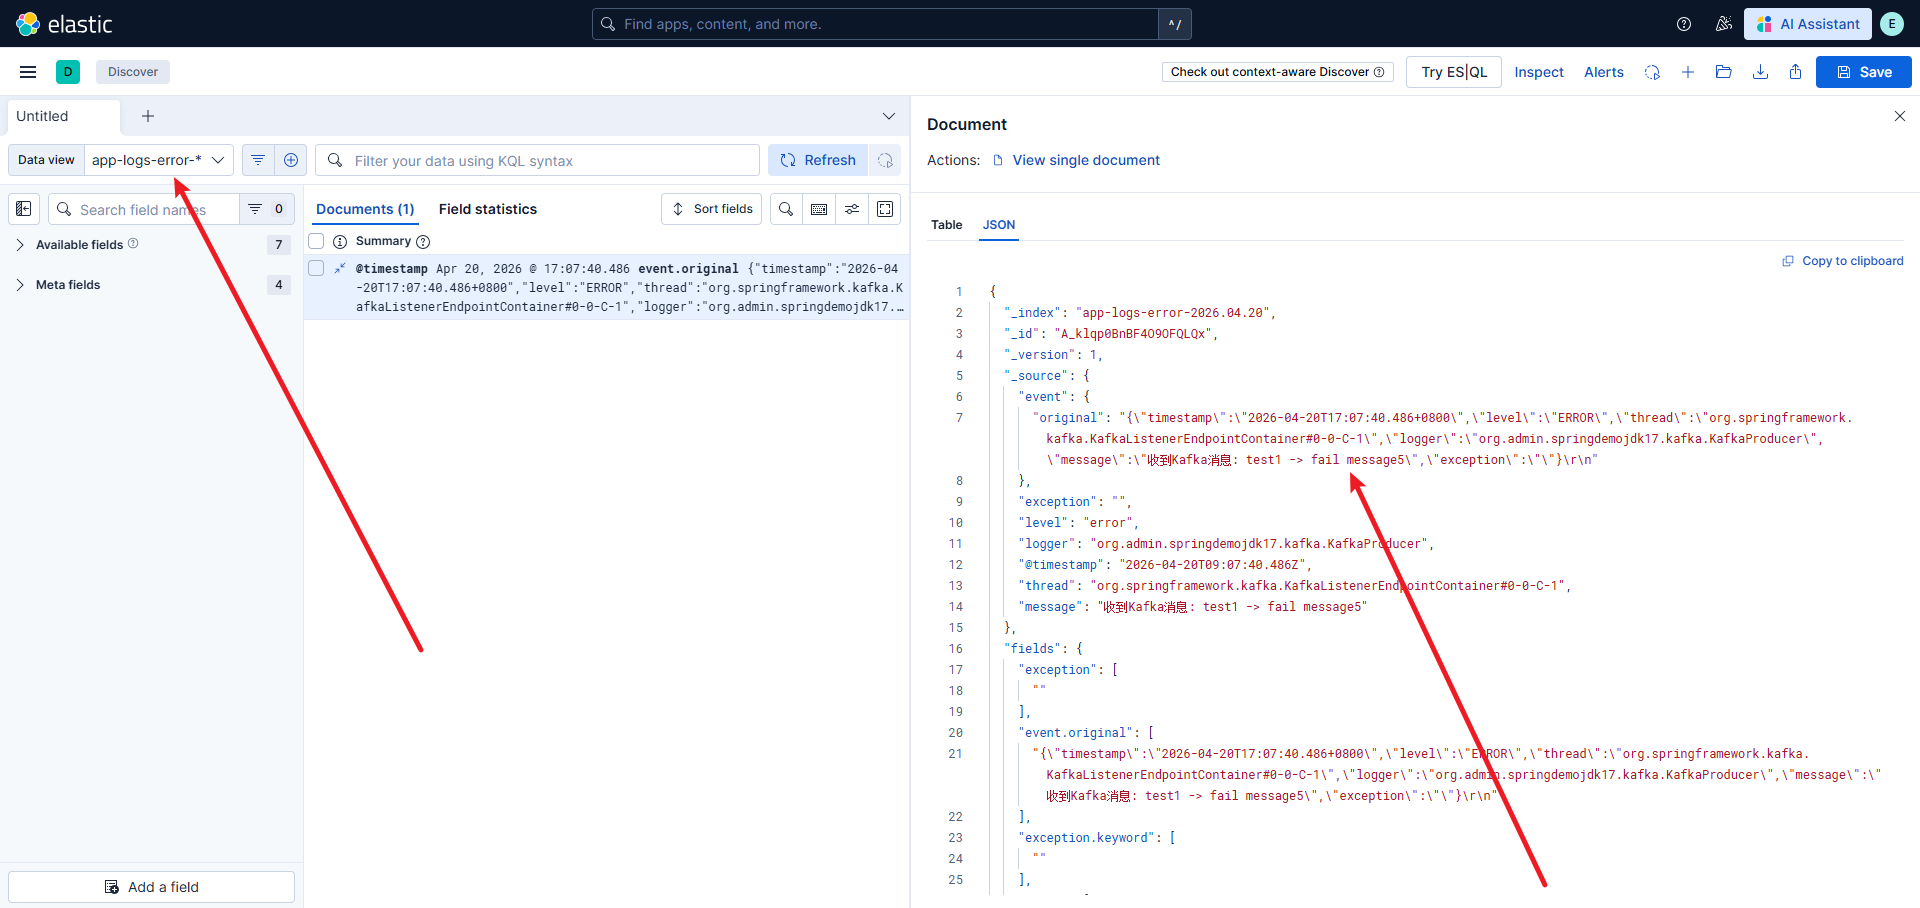
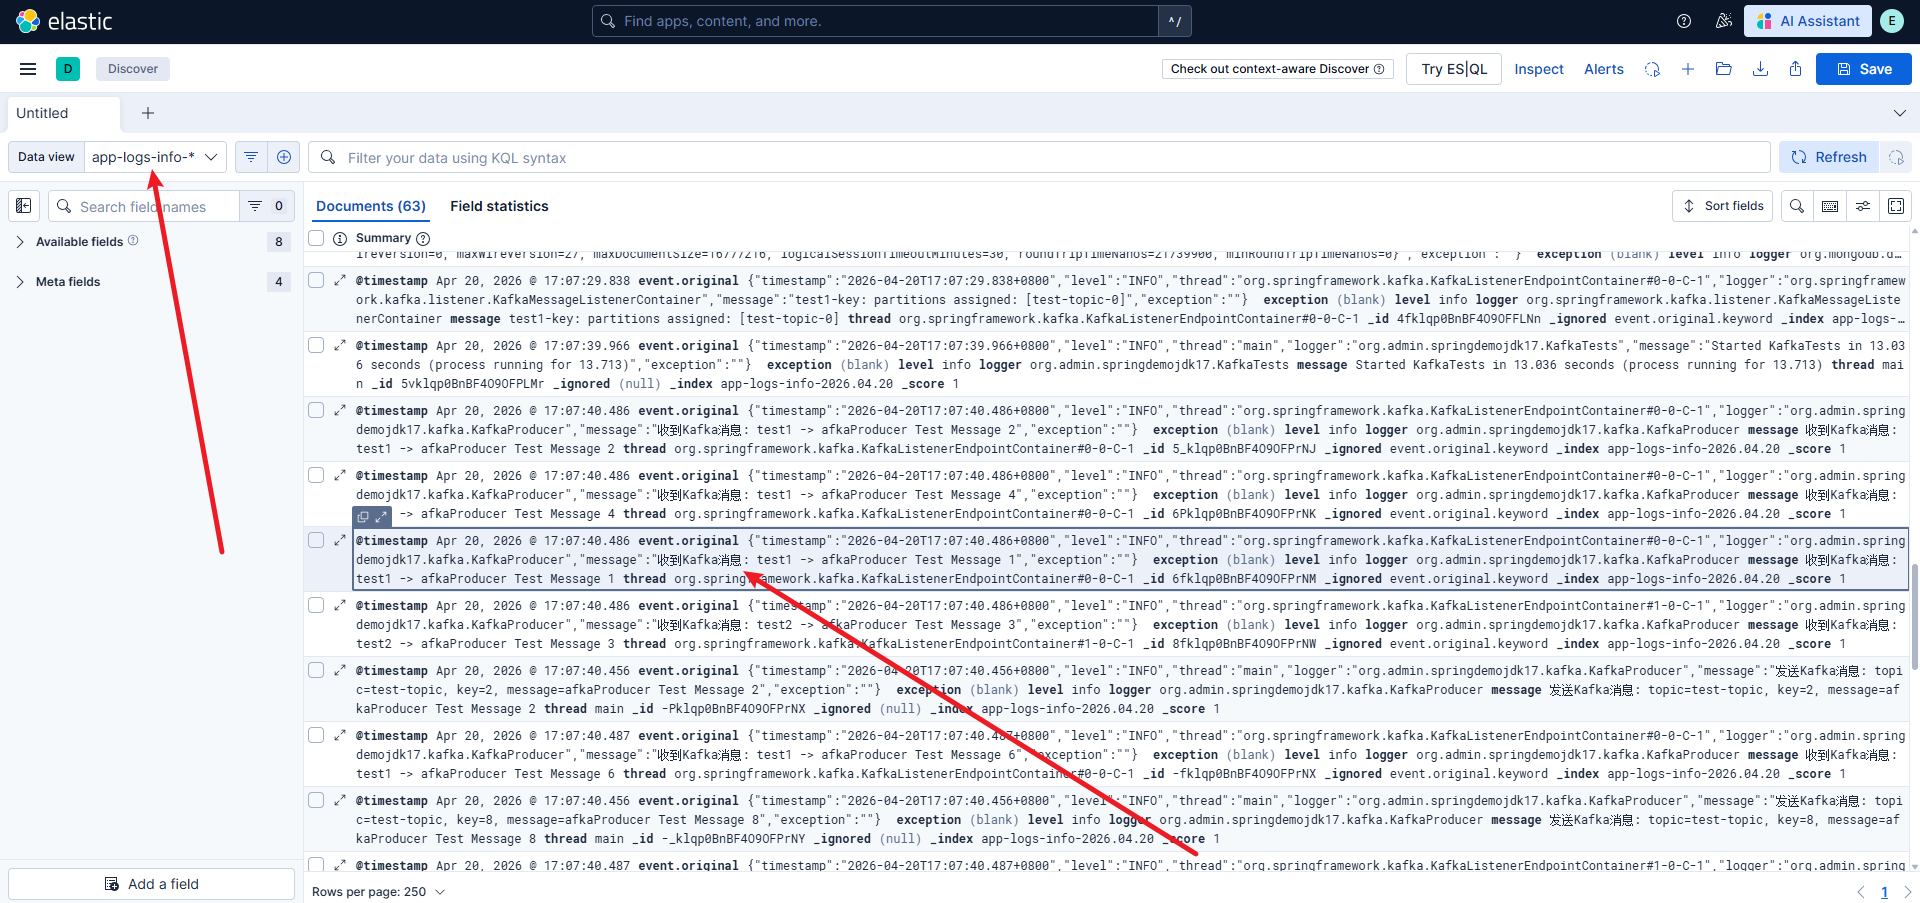 AI Visual Insight: This image shows the search results page in Kibana Discover. You will typically see a timeline, a field sidebar, and a document detail panel, which indicates that Elasticsearch has successfully stored structured log fields such as
 level, message, logger, and thread.
You can use Dev Tools to verify whether indices were created
GET _cat/indices?vThis command quickly confirms whether Logstash has written the log indices successfully.
When validating the pipeline, first confirm that messages are actually flowing
A practical approach is to continuously print info and error logs with test code, then observe both the Logstash console output and Elasticsearch index changes. If logs have already entered Kafka but Kibana shows no data, the issue is usually in Logstash or the Data View configuration.
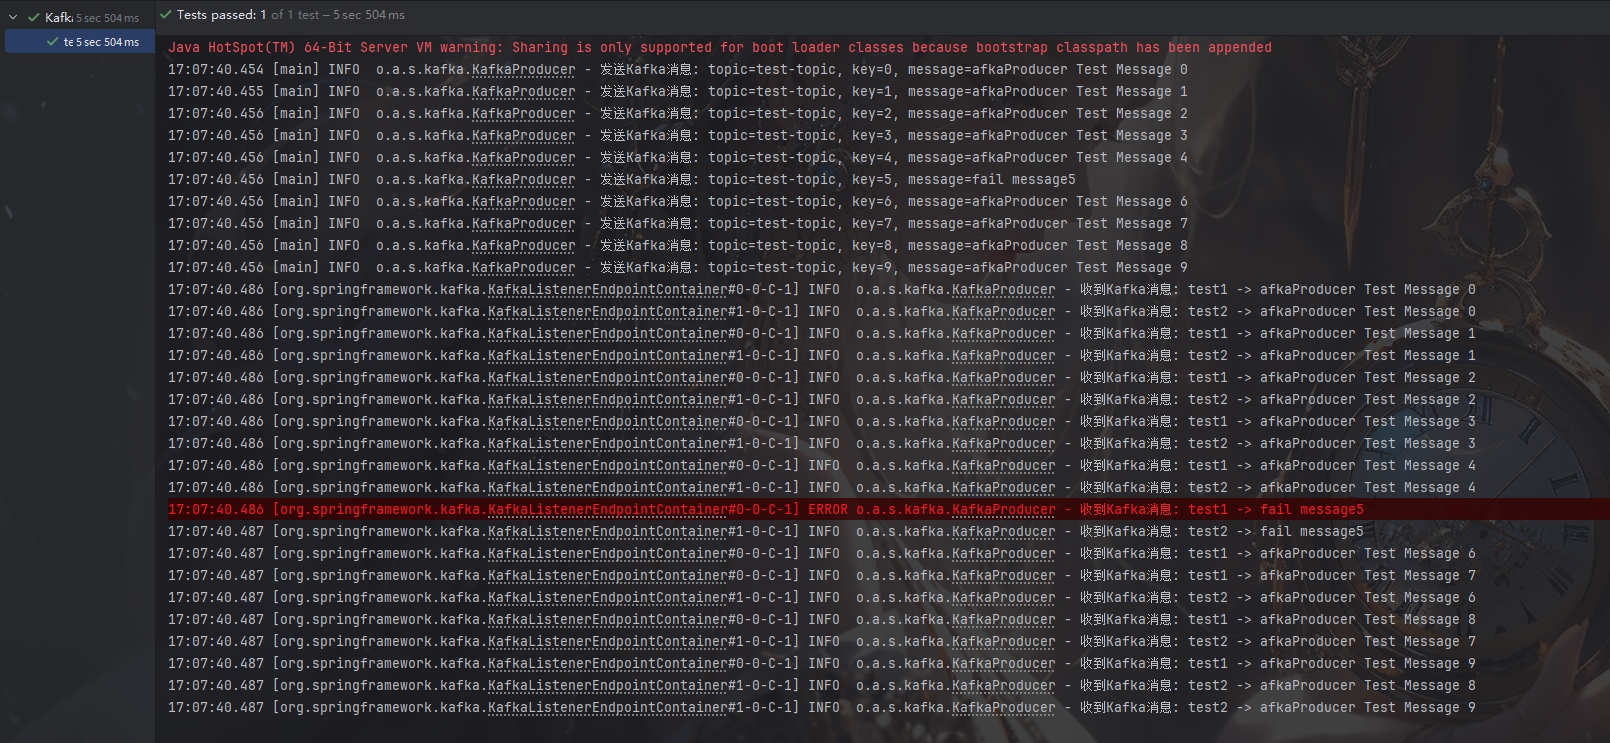 AI Visual Insight: This screenshot appears to show an application or pipeline validation result. The key point is to confirm whether error-level log samples exist, which helps verify that routing by
 level into app-logs-error-* is working as expected.
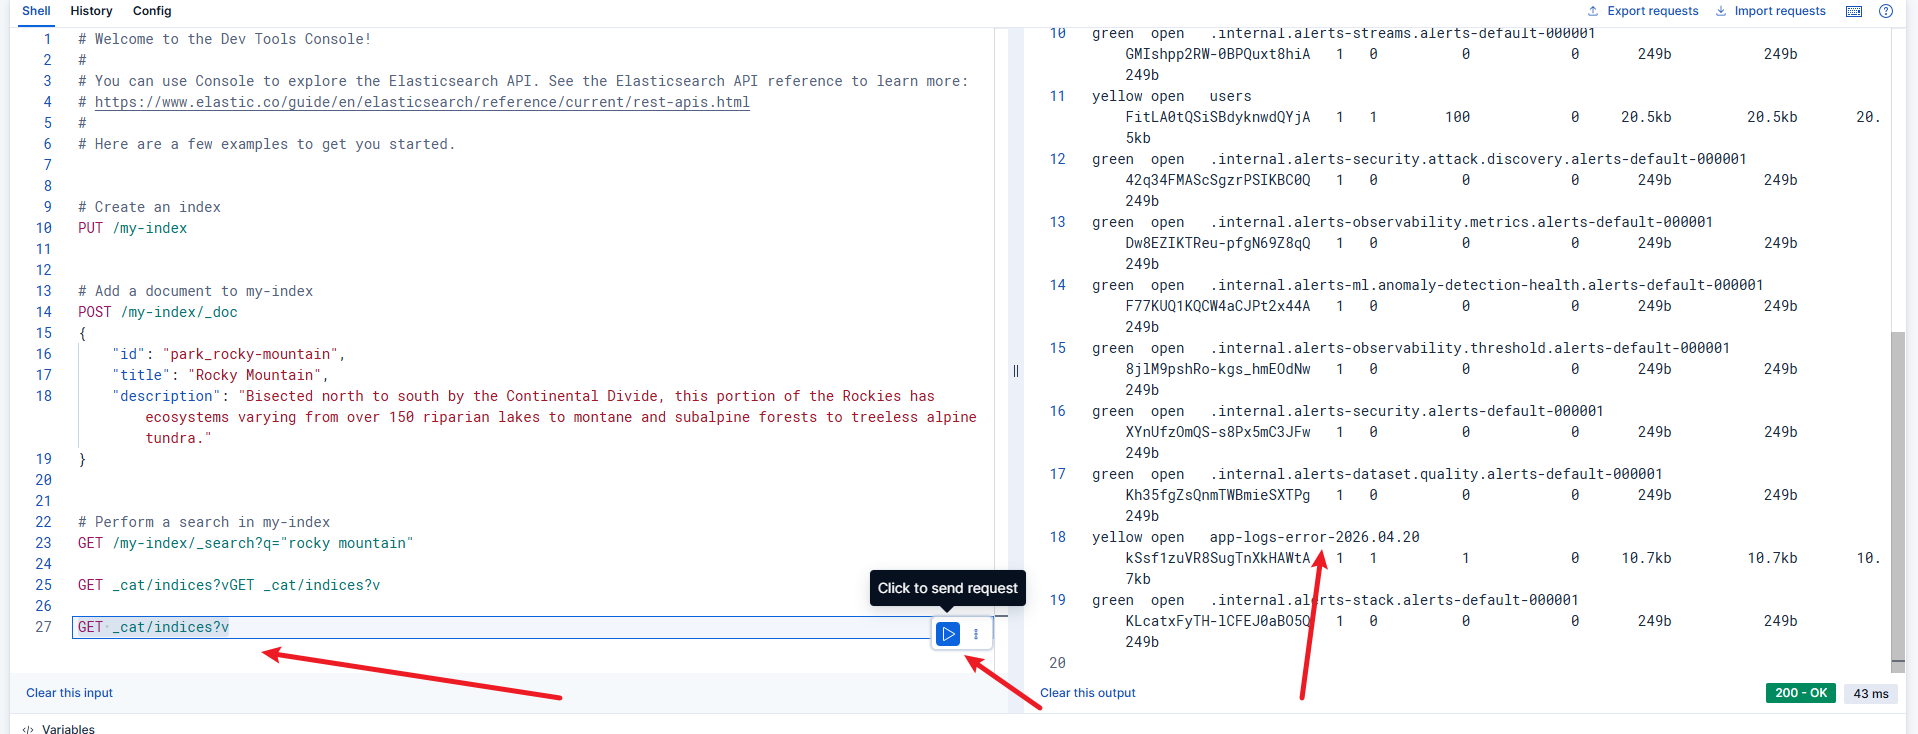 AI Visual Insight: This image shows the Elasticsearch index list. Technically, it confirms that date-rolled
 app-logs-info-* and app-logs-error-* indices already exist, which means the Kafka consumption, Logstash output, and Elasticsearch write path are fully connected.
A minimal test snippet is enough to verify the pipeline
@Slf4j
@Component
public class DemoLogService {
    public void emit() {
        log.info("Order service started successfully"); // Send a standard log
        log.error("Payment callback handling failed"); // Send an error log
    }
}
This code uses the fewest possible log events to verify whether JSON encoding, Kafka delivery, and Elasticsearch routing are working correctly.
Most common failures cluster around three boundaries
The first is the dependency boundary, where a typical problem is that logback-kafka-appender cannot be downloaded. The second is the network boundary, such as an incorrect bootstrap.servers value or port 9092 not being reachable. The third is the index boundary, where Elasticsearch has data but Kibana Data View has not been refreshed.
A recommended troubleshooting order is: application console logs, Kafka listening port, Logstash stdout, Elasticsearch _cat/indices, and Kibana Data View field refresh. This sequence is usually the fastest path to the root cause.
FAQ
Q1: Why does the application throw a StackOverflowError immediately on startup?
A: In most cases, the Kafka client logs are being sent back into Kafka by Logback, creating recursion. Bind a separate console appender to org.apache.kafka and set additivity="false" to fix it.
Q2: Why are no logs visible in Kibana?
A: First confirm that Logstash is consuming from Kafka successfully, then check whether Elasticsearch contains app-logs-info-* or app-logs-error-*. If the indices exist, the issue is most likely that the Data View has not been created or the selected time range is too narrow.
Q3: Why write to Kafka first instead of sending logs directly from the application to Elasticsearch?
A: Kafka provides traffic smoothing, buffering, decoupling, and log replay. Once the application is decoupled from the storage layer, replacing Logstash, adding consumers, or extending the alerting pipeline becomes much easier.
[AI Readability Summary]
This article reconstructs a centralized log collection solution based on Spring Boot, Logback, Kafka, and ELK. It covers component versions, startup steps, application configuration, Logstash routing and indexing, Kibana search, and common troubleshooting practices. The solution is well suited for building an enterprise-grade logging pipeline that is searchable, scalable, and loosely coupled.