Fireworks Tech Graph is a diagram generation skill built for AI coding agents. Its core capability is turning natural language descriptions into publication-ready SVG+PNG technical diagrams, solving the pain points of time-consuming manual drawing, inconsistent styling, and difficult maintenance. Keywords: AI diagram generation, SVG, Claude Code.
The technical specification snapshot shows a production-oriented diagram engine
| Parameter | Details |
|---|---|
| Project Name | Fireworks Tech Graph |
| Primary Languages | Python, Shell, SVG |
| Target Platforms | Claude Code, Codex, and other AI coding agents |
| Output Formats | SVG, PNG |
| Diagram Coverage | 14+ diagram types |
| Visual Styles | 7 |
| GitHub Stars | 3,700+ |
| Core Dependencies | Claude Skills / skillfish / SVG validation scripts |
| Core Value | Engineering-grade generation from natural language to publication-ready technical diagrams |
Fireworks Tech Graph redefines the AI technical diagramming workflow
Traditional technical diagrams often rely on draw.io, Visio, or handwritten SVG. The challenge is not whether teams can draw diagrams, but whether they can consistently produce structurally correct, semantically consistent, publication-ready visuals over time. Fireworks Tech Graph abstracts this work into a reusable skill that plugs directly into AI coding agent workflows.
This is not simply about “asking a large model to draw.” Instead, it uses a fixed process, a semantic shape vocabulary, arrow color conventions, and validation mechanisms to turn diagram generation into a repeatable engineering pipeline. That makes it especially well suited for documentation teams, AI system design, and technical blogging.
The project centers on skill-based diagram generation
At its core, Fireworks Tech Graph is a Skill. After installation, Claude Code or a similar agent can understand how to break a request into diagram type selection, layout rules, style constraints, and final export steps, then produce deliverable SVG and PNG outputs.
# Install the skill
# Claude Code users can install Fireworks Tech Graph directly
claude skills install yizhiyanhua-ai/fireworks-tech-graph

# Or install it with skillfish
npx skillfish add yizhiyanhua-ai/fireworks-tech-graph
These commands install the skill and give the AI agent structured technical diagramming capabilities.
The project ensures stable diagram output through a 10-step workflow
The full system can be divided into three stages: input and classification, style and mapping, and generation and validation. Its value comes from the fact that each step follows strong constraints rather than free-form generation.
The input and classification stage is responsible for understanding requirements
Steps 1 through 3 handle natural language parsing, diagram type recognition, and visual style selection. The system extracts core entities, relationships, and context from either Chinese or English descriptions, then matches them to the most appropriate diagram template.
The style and mapping stage is responsible for semantic rendering
Steps 4 through 6 map concepts to standard shapes and then apply layout rules and style systems. For example, agents are typically mapped to double-bordered hexagons, while vector stores are mapped to cylinders with grid textures. This makes the diagrams not only visually appealing, but also semantically consistent.
workflow = [
    "Parse requirements",      # Extract entities and relationships from natural language
    "Identify diagram type",  # Select an architecture diagram, sequence diagram, flowchart, and so on
    "Choose visual style",    # Match the target publishing context
    "Map semantic shapes",    # Convert concepts into standard graphical primitives
    "Plan layout",            # Preserve hierarchy, spacing, and alignment
    "Generate SVG",           # Output structurally correct graphic code
    "Validate and export"     # Run checks and generate PNG
]
This pseudocode summarizes the core pipeline behind Fireworks Tech Graph.
Seven visual styles cover publishing needs from blogs to product pages
The project includes seven built-in styles: Flat Icon, Dark Terminal, Blueprint, Notion Clean, Glassmorphism, Claude Official, and OpenAI Official. These styles do more than swap colors. They also adjust borders, backgrounds, hierarchy, and contrast relationships.
 AI Visual Insight: This image shows a technical architecture diagram in a flat icon style. It emphasizes high-contrast color blocks, consistent line widths, and standardized node spacing, making it ideal for blog cover images and fast understanding of system module boundaries.
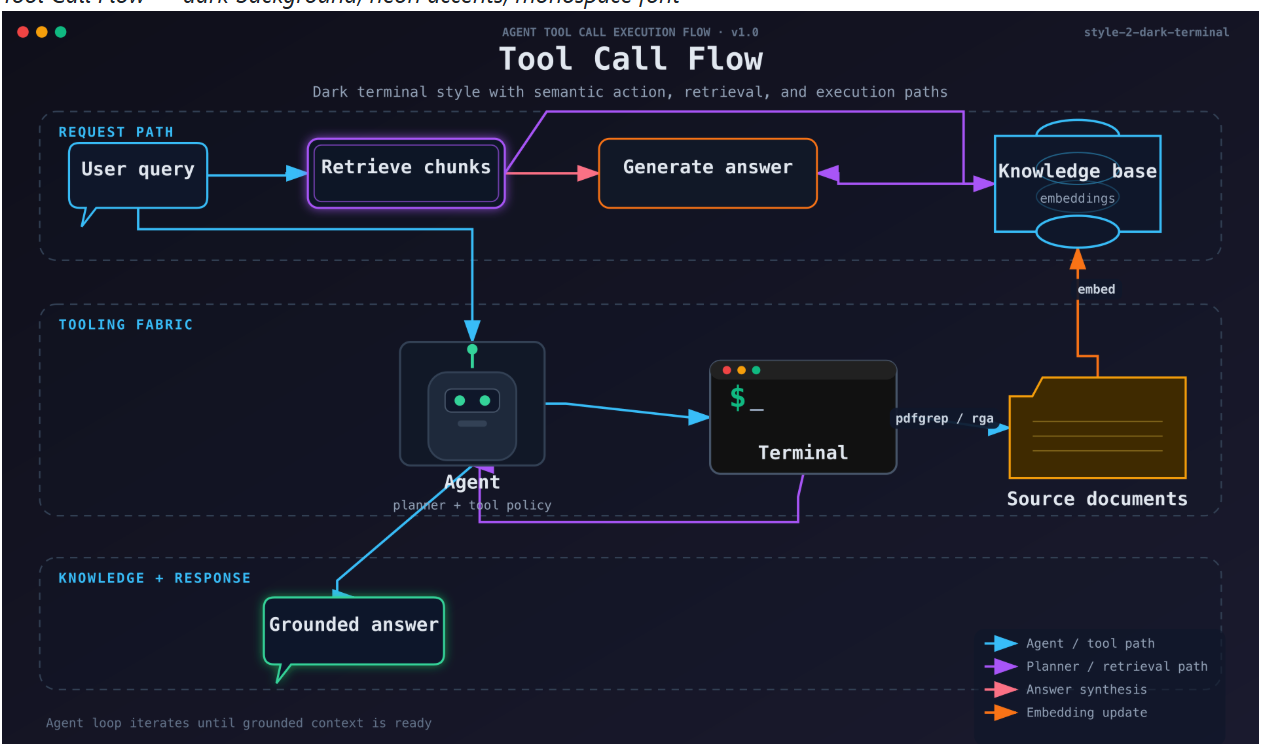 AI Visual Insight: This image presents a dark terminal-style diagram with a dark background, neon connectors, and terminal-inspired components. It works especially well for AI engineering, CLI toolchains, and developer-facing presentation pages.
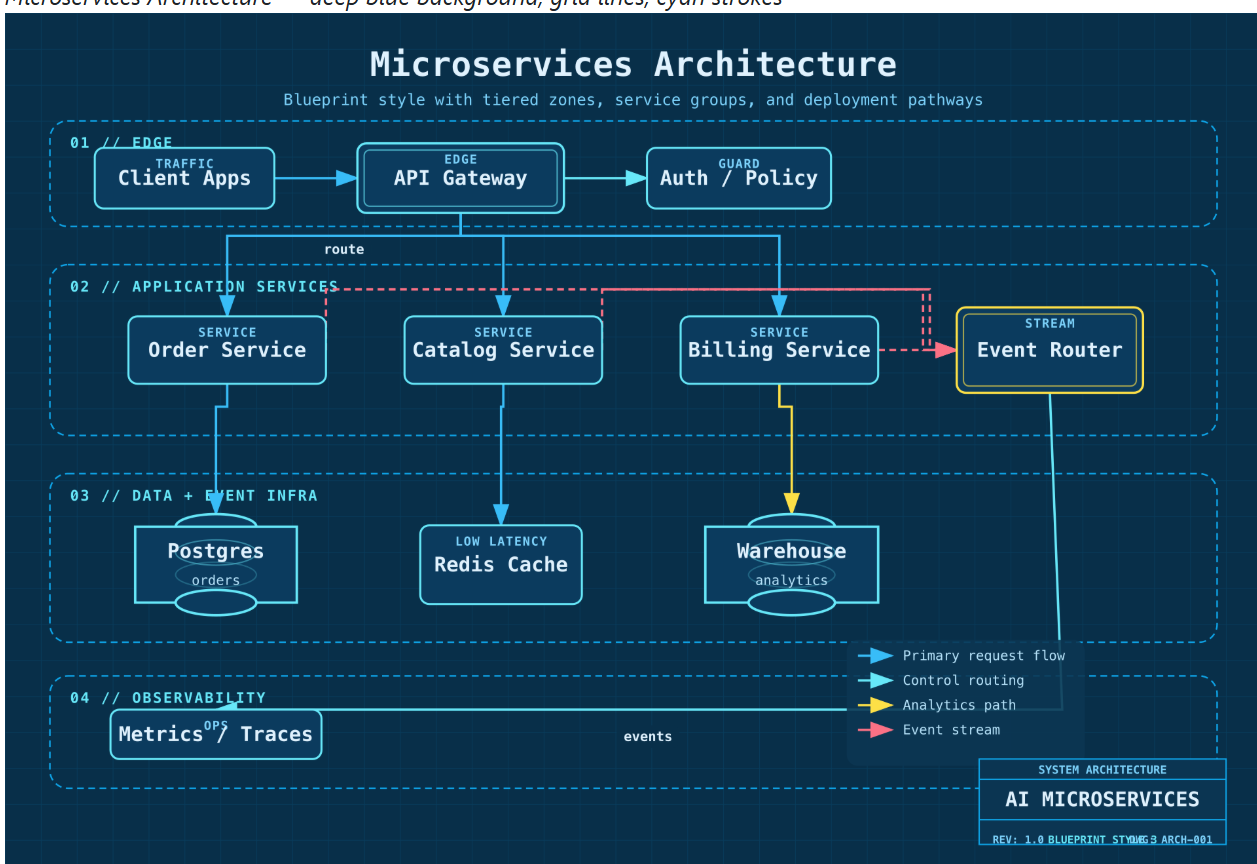 AI Visual Insight: This image demonstrates a blueprint-style grid layout with a background similar to engineering drafting paper. Component borders and connectors emphasize precise positioning, making it well suited for architecture reviews and design specification documents.
The style system directly affects information delivery efficiency
Notion Clean works better for knowledge bases and internal documentation. Glassmorphism emphasizes presentation value. Claude Official and OpenAI Official are better suited for AI product explanation pages. This coupling of semantic meaning and publishing context is one of the project’s key differentiators from general-purpose diagramming tools.
The project now provides complete coverage across 14 categories of technical diagrams
It supports architecture diagrams, class diagrams, ER diagrams, network topology diagrams, component diagrams, flowcharts, sequence diagrams, state machine diagrams, use case diagrams, activity diagrams, data flow diagrams, agent architecture diagrams, memory architecture diagrams, mind maps, and planning visuals such as timelines and comparison matrices.
That means it serves not only software engineering, but also newer scenarios such as AI agents, RAG, memory systems, and multi-agent collaboration. In AI system design especially, diagram structures are often complex and updated frequently, so the payoff from automated generation is substantial.
# Generate a microservices architecture diagram
# Use a natural language description of the system components directly
claude "Generate a microservices architecture diagram that includes an API gateway, user service, order service, and database"

# Generate a RAG architecture diagram in blueprint style
# The selected style affects color, layout, and visual semantics
claude "Generate a RAG system architecture diagram in blueprint style"
These commands show the most direct usage model: letting AI generate diagrams directly from descriptions.
Built-in AI architecture patterns make it especially effective for Agent and RAG scenarios
Fireworks Tech Graph includes multiple built-in patterns for AI domains, including RAG pipelines, agentic search, Mem0-style memory layers, multi-agent collaboration, and tool-calling loops. It does not just draw components; it also understands the differences among data flow, control flow, and feedback loops.
For example, a common RAG path is “query → embedding → vector retrieval → augmentation → LLM → response.” In multi-agent scenarios, the diagram often needs to emphasize fan-out from the orchestrator to multiple sub-agents and fan-in from an aggregator. When drawn manually, these patterns easily result in messy arrows and unclear semantics.
The semantic shape system and arrow system form the project’s engineering moat
The project defines different shapes for users, LLMs, agents, short-term memory, long-term memory, vector databases, graph databases, tools, APIs, and decision nodes. It then combines them with blue data flows, orange control flows, green memory read/write paths, purple feedback loops, and gray asynchronous flows so the structure becomes understandable at a glance.
When multiple arrow types appear in the same diagram, a legend is required. The system also checks for text overflow, arrow collisions, container boundaries, and layout discipline. These validation mechanisms are what make the output “publication-ready” rather than merely “presentation-ready.”
Supporting scripts further strengthen automated validation capabilities
The project includes four supporting scripts: generate-diagram.sh, generate-from-template.py, validate-svg.sh, and test-all-styles.sh. These handle generation, template reuse, SVG inspection, and style consistency testing respectively.
# Validate SVG structure and semantic constraints
# Suitable for CI quality gates
./validate-svg.sh output/diagram.svg

# Batch test all styles
# Ensure the same semantics remain consistent across different styles
./test-all-styles.sh
These scripts show that Fireworks Tech Graph is not just a prompt collection. It has real engineering properties and can integrate into CI/CD pipelines.
The project is a strong fit for teams that produce technical diagrams at high frequency
If your work involves architecture documentation, AI system proposals, product white papers, developer blogs, or internal knowledge bases, the value of this project is immediate. It reduces diagramming time, standardizes visual conventions, lowers maintenance costs, and gives AI agents real diagram production capability.
It represents a new workflow: developers no longer drag shapes manually. Instead, they maintain a combination of requirement descriptions, semantic rules, and validation scripts. When the system changes, they only need to update the description and regenerate the diagram, making it much easier to keep documentation in sync with the system.
FAQ provides structured answers to common adoption questions
1. What is the biggest difference between Fireworks Tech Graph and Mermaid or draw.io?
It is not a standalone diagram syntax or a manual drawing tool. It is a skill system designed for AI agents. Its core strengths are semantic mapping, style consistency, automated validation, and dual-format export, which make it better suited for continuous engineering-grade generation.
2. Which teams benefit most from this project?
It is best suited for AI engineering teams, technical writers, architects, and R&D organizations that frequently update system diagrams. The more often diagrams change, the higher the return from automation.
3. Is it only for AI architecture diagrams?
No. It supports UML, flowcharts, ER diagrams, network diagrams, component diagrams, timelines, comparison matrices, and more. However, its strengths are most obvious in AI scenarios such as RAG, agents, and memory systems.
Core Summary: Fireworks Tech Graph is a diagram generation skill for AI coding agents such as Claude Code and Codex. It can reliably convert natural language into publication-ready SVG+PNG technical diagrams. This article breaks down its 10-step workflow, 14 diagram categories, 7 styles, semantic shape system, and validation scripts to help developers understand its engineering value.