[AI Readability Summary] This guide explains a black-box monitoring approach focused on real user reachability. By using Prometheus to collect HTTP, TCP, ICMP, and DNS probe results from Blackbox Exporter, you can detect hidden failures where processes remain online but services are no longer reachable, and identify network path issues early with alerting rules. Keywords: Prometheus, Blackbox Exporter, black-box monitoring.
The technical specification snapshot is straightforward
| Parameter | Description |
|---|---|
| Core language | Go (Prometheus and Blackbox Exporter) |
| Monitoring model | White-box monitoring + black-box probing |
| Supported protocols | HTTP, HTTPS, TCP, ICMP, DNS |
| Default ports | Blackbox Exporter: 9115; Prometheus: 9090; cpolar: 9200 |
| Deployment environment | Ubuntu / Linux |
| Core dependencies | Prometheus, Blackbox Exporter, systemd, cpolar (optional) |
| Data sources | /probe probe results and Prometheus scrape jobs |
| Applicable scenarios | Website availability, API connectivity, packet loss on network paths, remote monitoring access |
Traditional white-box monitoring does not cover real reachability issues
Prometheus excels at collecting internal application metrics such as CPU, memory, QPS, error rates, and custom business metrics. However, these metrics only prove that the service appears healthy internally. They do not prove that users can actually reach it.
Typical failures include hung processes, DNS resolution errors, mistaken security policy blocks, and complete failure of load balancer backends. In these cases, /metrics may still return normally while user requests are already timing out or failing outright.
Blackbox Exporter adds value by actively probing from the outside
Blackbox Exporter is the official black-box probing component in the Prometheus ecosystem. It does not require the target service to expose metrics. Instead, it simulates a client request from the network side and converts the result into Prometheus-scrapable metrics.
# Create the deployment directory
mkdir -p /app
cd /app

# Extract the package
tar -zxvf blackbox_exporter-0.27.0.linux-arm64.tar.gz

# Normalize the directory name for easier maintenance
mv blackbox_exporter-0.27.0.linux-arm64 blackbox_exporter
These commands complete the basic installation layout for Blackbox Exporter and normalize the directory structure.
 AI Visual Insight: The image illustrates the monitoring scenario behind this article. The key idea is to extend Prometheus beyond traditional metric scraping into external network probing so you can detect link-layer failures where a service is online but user access still fails.
In Ubuntu, you should manage the process with systemd in the standard way
The original systemd example mixed in an Alertmanager path. In production, you should correct it to the actual Blackbox Exporter startup command. Otherwise, the service name and the running process will not match, which makes troubleshooting much harder.
[Unit]
Description=Prometheus Blackbox Exporter
After=network.target

[Service]
Type=simple
User=root
Restart=on-failure
ExecStart=/app/blackbox_exporter/blackbox_exporter \
  --config.file=/app/blackbox_exporter/blackbox.yml

[Install]
WantedBy=multi-user.target
This service file hands Blackbox Exporter over to systemd and explicitly sets the configuration file path.
# Reload the systemd configuration and start the service
systemctl daemon-reload
systemctl start blackbox_exporter.service
systemctl enable blackbox_exporter.service
systemctl status blackbox_exporter.service
These commands start the service, enable it at boot, and verify its status.
 AI Visual Insight: The image shows the package uploaded into a target directory on a Linux server. This indicates an offline download and manual upload workflow, which works well in restricted networks or internal environments.
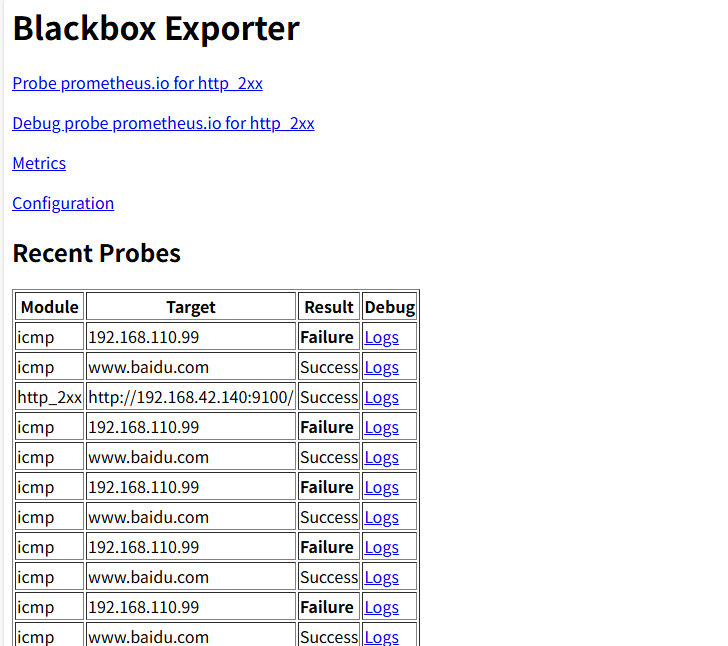
Blackbox module configuration defines the probing protocol and behavior
The core of Blackbox Exporter is modules. Each module defines a probing strategy. For example, http_2xx checks HTTP status codes, icmp handles ping probes, and tcp_connect verifies whether a TCP handshake can be completed.
modules:
  http_2xx:
    prober: http
    timeout: 5s

  tcp_connect:
    prober: tcp
    timeout: 5s

  icmp:
    prober: icmp
    timeout: 5s
    icmp:
      preferred_ip_protocol: ip4  # Prefer IPv4 to avoid errors in dual-stack environments
This configuration defines the three most commonly used probe modules and can be applied directly to websites, ports, and network path monitoring.
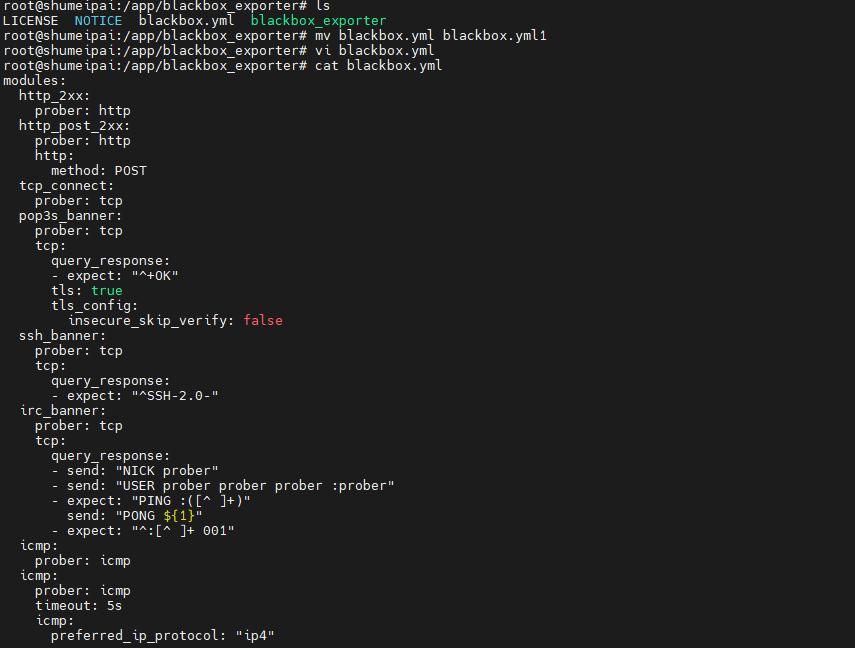 AI Visual Insight: The image reflects the editing process for
 blackbox.yml. The key point is that modules defines probe types, timeout settings, and protocol details, which directly determine black-box probe accuracy.
Prometheus should scrape probe results through /probe
Prometheus does not scrape target endpoints directly. Instead, it converts the target into __param_target through relabel_configs, then forwards it to the /probe endpoint of Blackbox Exporter. This is the standard integration pattern.
scrape_configs:
  - job_name: "http_probe"
    metrics_path: /probe
    scrape_interval: 60s
    params:
      module: [http_2xx]
    static_configs:
      - targets:
          - http://192.168.50.134:9100/
    relabel_configs:
      - source_labels: [__address__]
        target_label: __param_target  # Inject the target address into the probe parameters
      - source_labels: [__param_target]
        target_label: instance
      - target_label: __address__
        replacement: 192.168.50.134:9115  # Scrape Blackbox Exporter in practice

  - job_name: "ping_monitor"
    metrics_path: /probe
    params:
      module: [icmp]
    static_configs:
      - targets:
          - www.baidu.com
          - www.google.com
    relabel_configs:
      - source_labels: [__address__]
        target_label: __param_target
      - source_labels: [__param_target]
        target_label: instance
      - target_label: __address__
        replacement: 192.168.50.134:9115
This configuration brings both HTTP and ICMP targets into a unified Prometheus collection workflow.
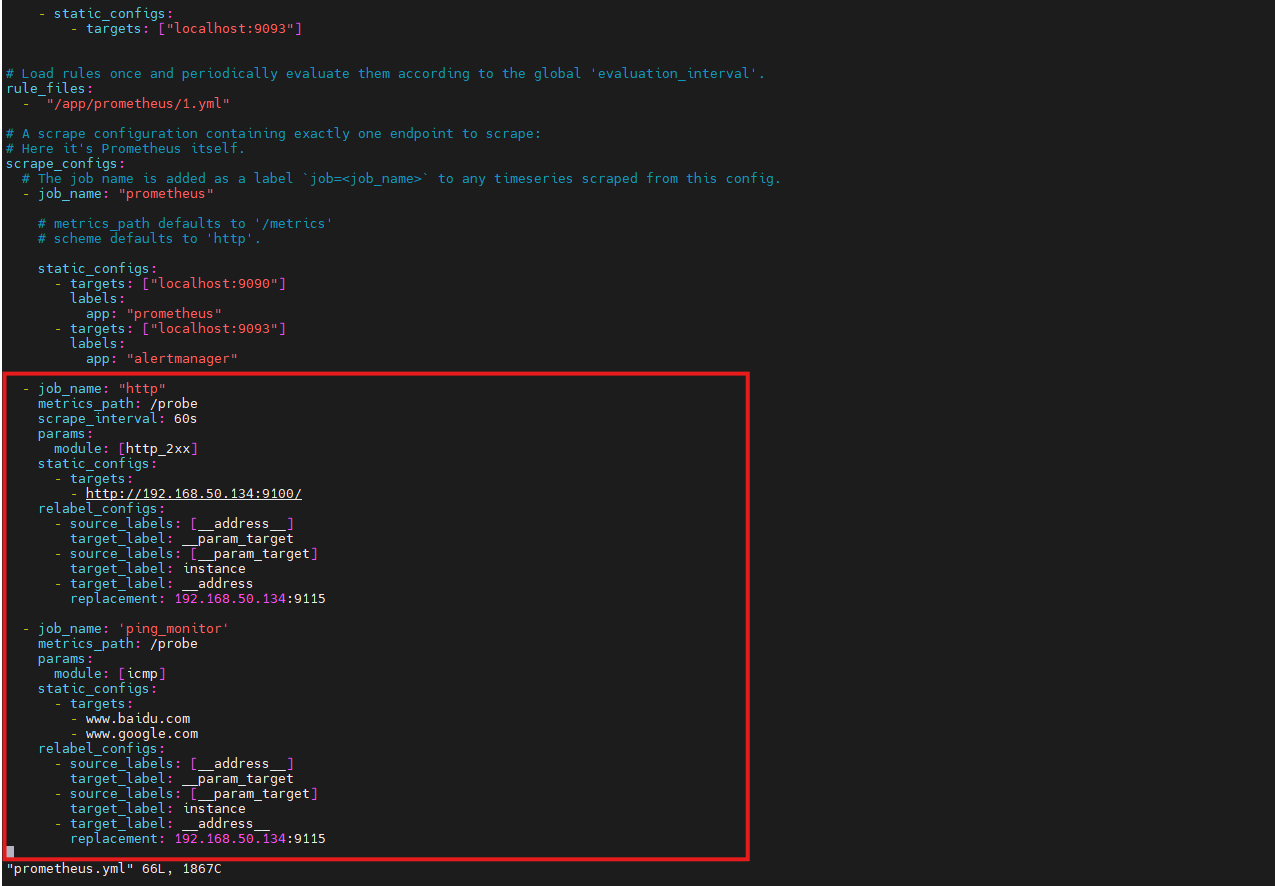 AI Visual Insight: The image shows the job view after the Prometheus configuration was updated, indicating that Blackbox probe results have been added to the scrape target list and are now available for queries and alert evaluation.
Alerting rules should focus on failure rate and duration
A single failed probe does not always indicate a real incident. It may only be transient jitter. A better approach is to calculate the success rate over a time window and then apply a duration threshold to reduce false positives.
groups:
  - name: icmp-loss-alerts
    rules:
      - alert: HighPingLossRate
        expr: 1 - avg_over_time(probe_success{job="ping_monitor"}[5m]) > 0.5
        for: 2m
        labels:
          severity: warning
        annotations:
          summary: "High Ping packet loss rate (instance: {{ $labels.instance }})"
          description: "Target {{ $labels.instance }} has experienced more than 50% packet loss over the last 5 minutes"
This rule derives packet loss from probe_success and works well for detecting sustained path issues.
# Restart services to apply the configuration
systemctl restart blackbox_exporter.service
systemctl restart prometheus
These commands reload the runtime configuration after you modify modules, scrape jobs, or alerting rules.
 AI Visual Insight: The image shows the result page after the alerting rules were loaded, indicating that Prometheus has parsed the rules successfully and started evaluating thresholds based on probe data.
cpolar only solves remote access and is not part of the monitoring core path
The purpose of introducing cpolar in this setup is to expose the local port 9090 to the public internet so you can access the Prometheus dashboard remotely. It does not improve probing capability. It only solves the access entry point problem, so it should be treated as an optional enhancement.
# Install cpolar with one command
sudo curl https://get.cpolar.sh | sh

# Check the service status
sudo systemctl status cpolar
These commands install cpolar and verify service health, which is useful when you want to enable remote access quickly.
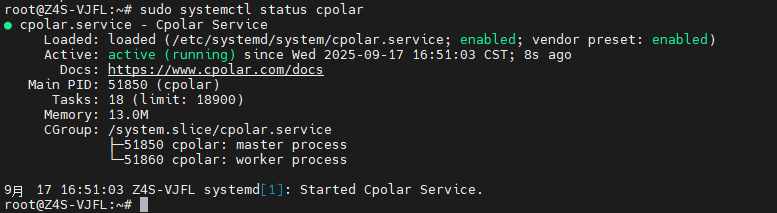 AI Visual Insight: The image shows that the cpolar systemd service is running, indicating that the tunneling proxy is ready to be configured and can be used to create an HTTP tunnel for the local monitoring dashboard.
A fixed public address is better for long-term operations
A random public address is suitable for temporary access, but it is not ideal for team documentation, runbooks, or external integrations. Once you reserve a fixed subdomain, the Prometheus access endpoint becomes much more stable.
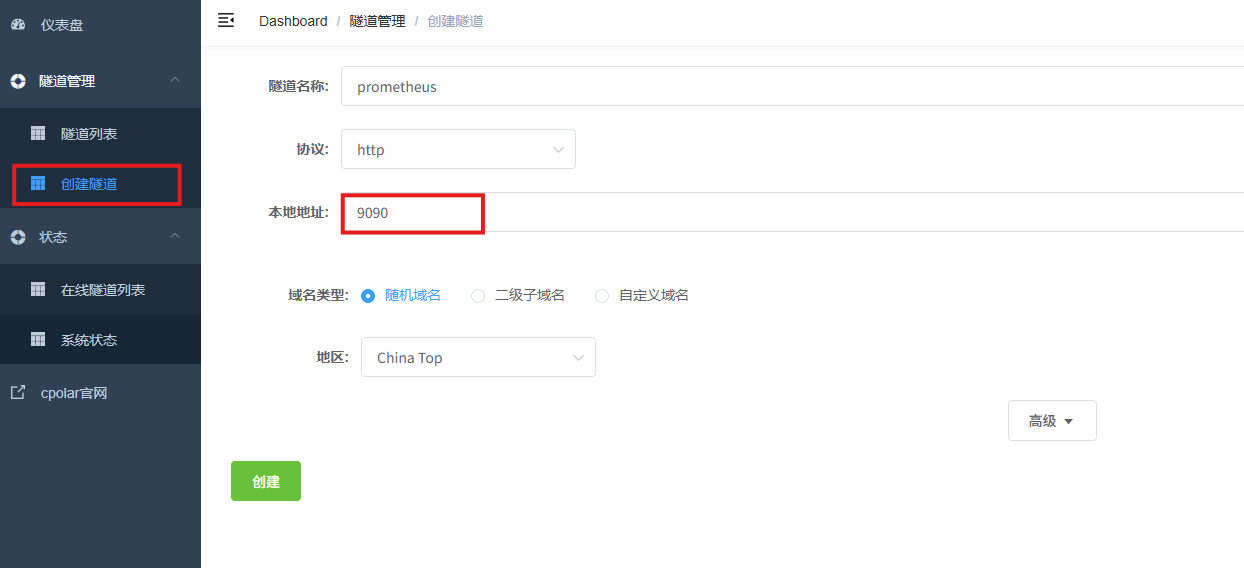 AI Visual Insight: The image shows the HTTP tunnel configuration options in the cpolar web UI, including the tunnel name, protocol, local port, and region. The goal is to expose the local port 9090 as a public endpoint.
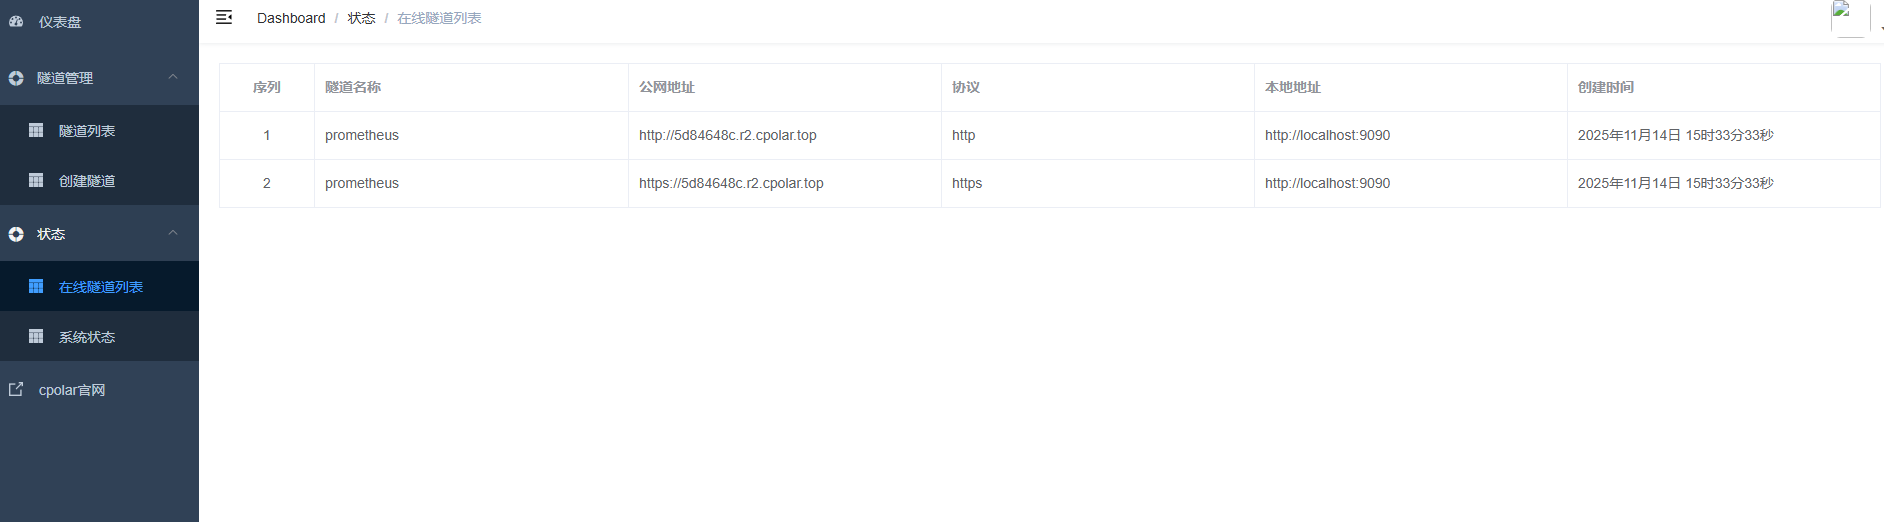 AI Visual Insight: The image shows the public access addresses generated after tunnel creation, indicating that the Prometheus web interface is now accessible across networks and can be opened directly in a remote browser.
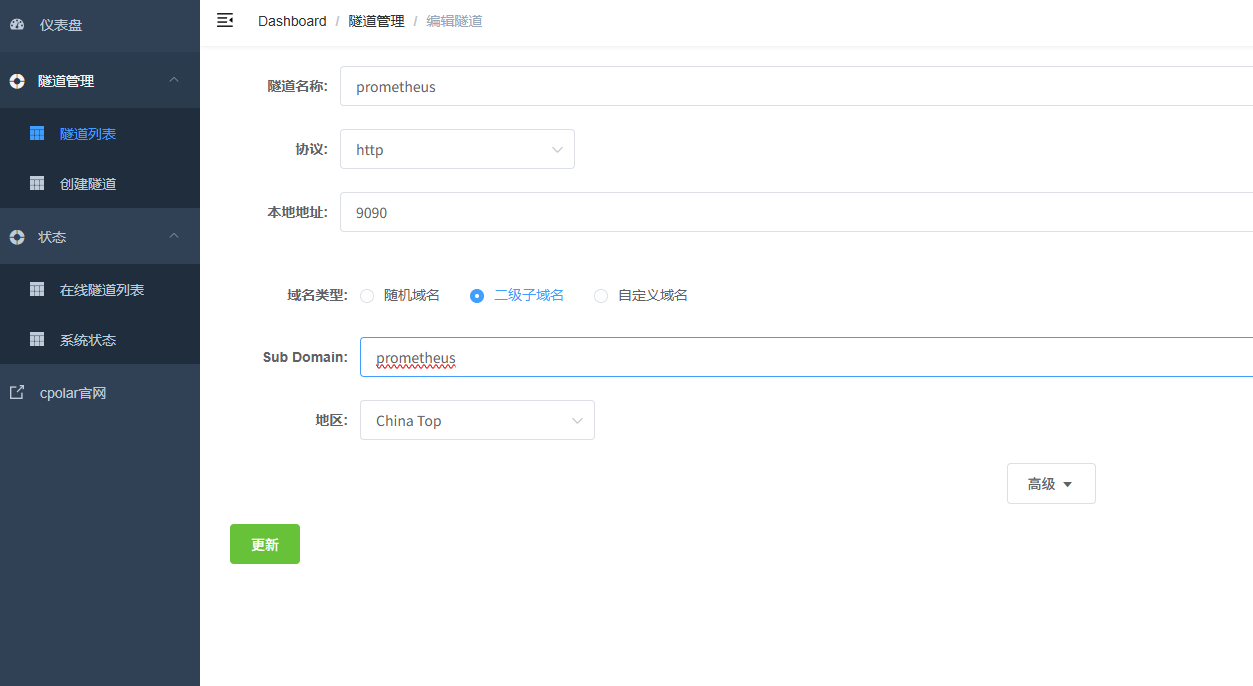 AI Visual Insight: The image shows the configuration steps for upgrading a random address to a fixed subdomain. This significantly improves operational stability by reducing access failures caused by changing endpoints.
The core value of this solution is upgrading from process monitoring to user-perspective monitoring
White-box monitoring answers the question, “Is anything wrong inside the service?” Black-box monitoring answers, “Can users actually reach it?” In production, the second question is often much closer to the real business impact.
If you already run Prometheus, the cost of adding Blackbox Exporter is low, but the operational value is high. At a minimum, you should cover four target categories: critical pages, core APIs, external DNS, and ICMP probes on primary network paths.
FAQ uses a structured Q&A format
1. Why is up=1 while users still cannot access the service?
up=1 only means that Prometheus can scrape the target metrics endpoint. It does not mean the real user path is reachable. If DNS, WAF, SLB, ACL, or the TCP handshake fails, the service can still be unavailable.
2. Which Blackbox Exporter modules should you prioritize first?
Start with http_2xx, tcp_connect, and icmp. Together, they cover page and API availability, port connectivity, and link-layer health, making them the highest-value starting point.
3. Is cpolar a required component?
No. The monitoring core path only requires Prometheus and Blackbox Exporter. cpolar is only useful when you need to access a local Prometheus dashboard from the public internet.
Core takeaway: This article systematically reconstructs a black-box monitoring solution built on Prometheus and Blackbox Exporter. It covers Ubuntu deployment, HTTP and ICMP probing, Prometheus scraping, packet-loss alerting, and an optional cpolar remote access setup, helping operations teams move from monitoring process survival to monitoring real user reachability.