This article focuses on the YFIOs IoT platform and walks through the full workflow for a Hexa-Tower environmental monitoring device using a YF3028 gateway for RS485 data collection, cloud connectivity, historical trend visualization, and Excel export. It addresses common pain points such as complex device onboarding, poor data persistence, and fragmented analysis pipelines. Keywords: YFIOs, RS485, IoT cloud ingestion.
The technical specification snapshot outlines the deployment baseline
| Parameter | Description |
|---|---|
| Platform | YFIOs cloud platform + YFIOs cloud management tool + edge intelligence tool |
| Communication Interface | RS485 |
| Gateway Model | YF3028 |
| Sensor Device | Hexa-Tower environmental monitoring device |
| Deployment Methods | Docker, Ubuntu, Windows |
| Core Capabilities | Real-time acquisition, cloud onboarding, historical data, trend analysis, Excel export |
| Protocol Pattern | Gateway access + cloud platform connection strategy |
| Star Count | Not provided in the source |
| Core Dependencies | Docker, LAN, AccessKey, XML configuration files |
This article provides a repeatable end-to-cloud IoT onboarding path
The core value of YFIOs is not a single feature. It lies in connecting sensors, gateways, edge tools, cloud platforms, and data governance into a closed loop. In industrial environments, the most common challenge is not collecting data. It is getting data to the cloud reliably and turning it into structured, durable assets.
Using the Hexa-Tower as an example, the device integrates sensors for light intensity, temperature and humidity, CO2, atmospheric pressure, and more, and outputs data over RS485. The YF3028 gateway handles collection and forwarding, while YFIOs manages devices, stores data, displays trends, and exports reports.
The Hexa-Tower device supports multi-environment parameter acquisition
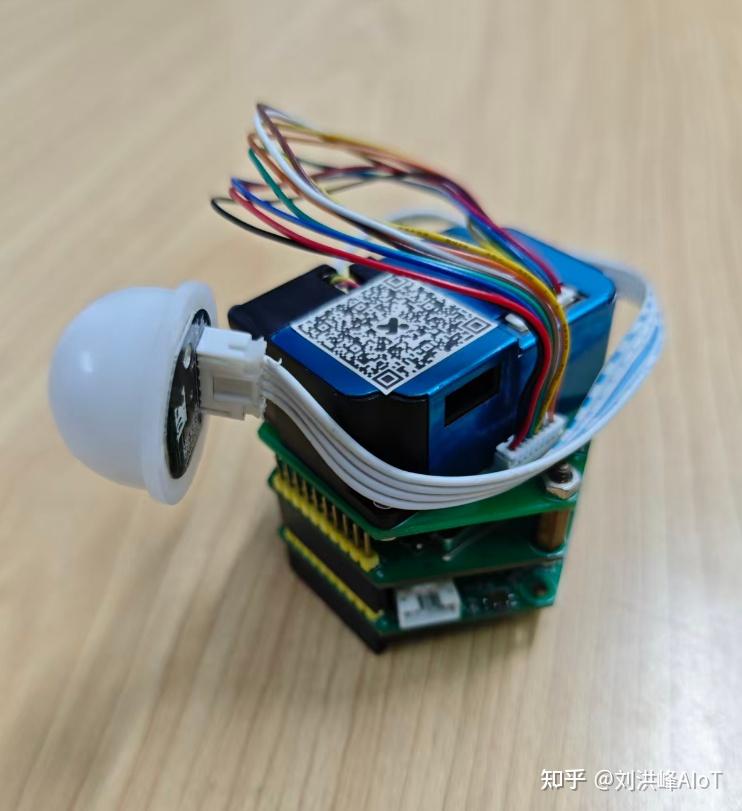 AI Visual Insight: The image shows the physical structure of the Hexa-Tower environmental monitoring device, highlighting its tower-style form factor and integrated multi-sensor design. This indicates that the device is well suited for synchronized multi-parameter sampling in campuses, agriculture, and building environments.
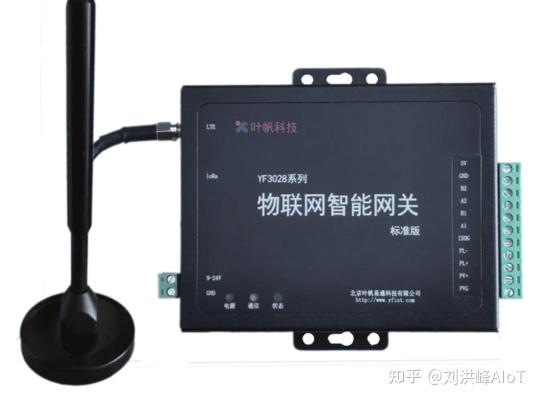 AI Visual Insight: This image further shows the device appearance and installation details. It suggests that the device provides standardized interfaces and on-site deployment capabilities, making it suitable as an edge acquisition terminal on an RS485 bus network.
Correct wiring and parameter matching determine whether edge acquisition succeeds
The first step is hardware connection. The Hexa-Tower connects to the corresponding serial port on the YF3028 through RS485 A+ and B-. Its power supply range is DC 9-24V. After connecting the LAN cable, you can complete platform deployment and debugging within the local network.
The second step is firmware and device parameter configuration. In the edge intelligence tool, you must enter the device address, baud rate, and serial port number. In most field failures, the issue is not the platform itself. It is usually reversed A/B wiring, address conflicts, or mismatched baud rates.
# Core checklist: verify the physical layer first, then verify serial port parameters
# 1. RS485 wiring: A+ to A+, B- to B-
# 2. Serial port selection: configure according to the actual YF3028 interface number
# 3. Address and baud rate: keep them consistent with the Hexa-Tower firmware
This checklist helps quickly isolate the typical case where the device appears online but no real-time data is available.
The edge intelligence tool handles device registration and real-time monitoring
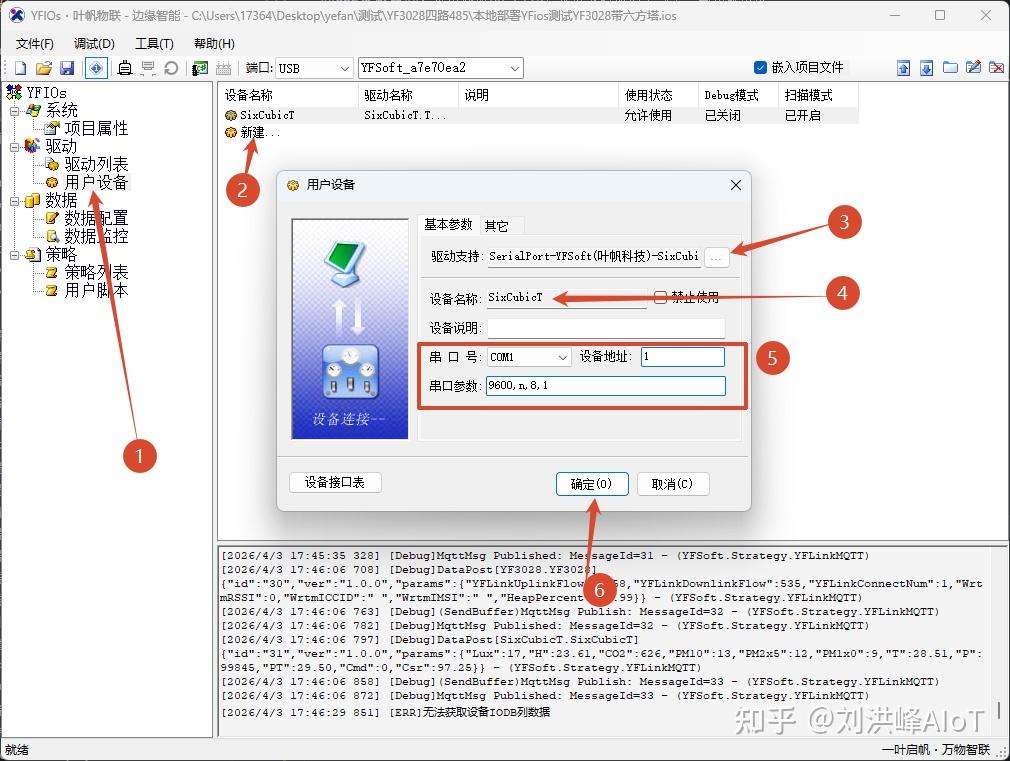 AI Visual Insight: The image shows the device onboarding interface in the edge intelligence tool, including user device creation, serial port selection, and parameter configuration areas. It reflects the tool’s role in protocol adaptation and edge-side debugging.
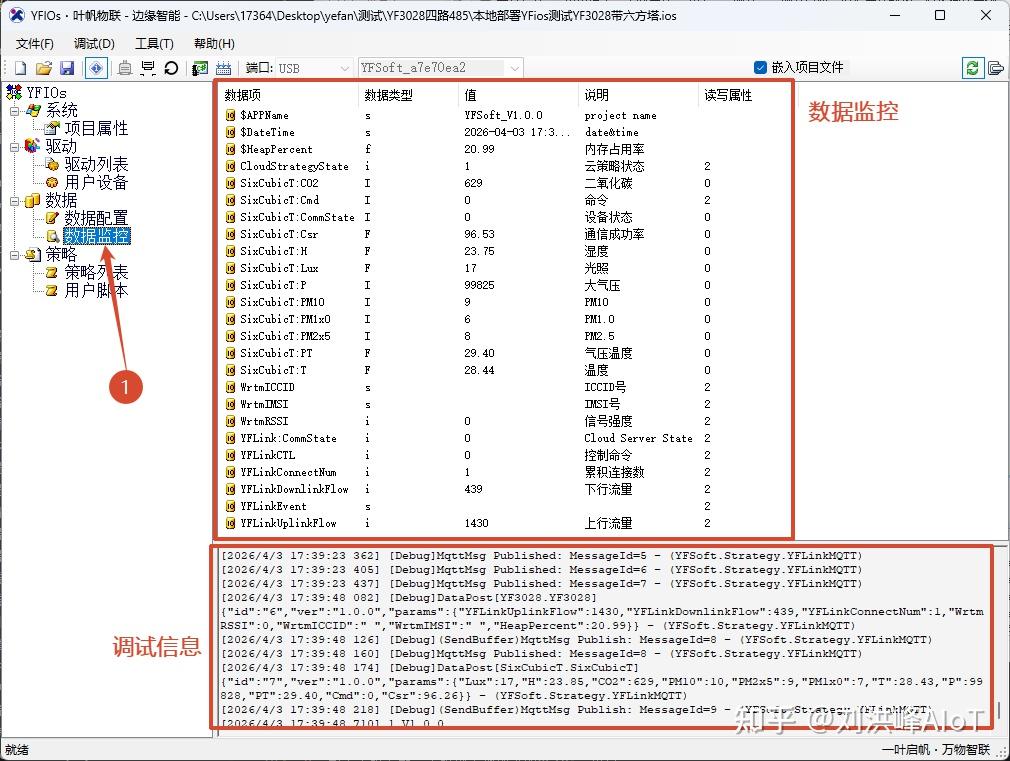 AI Visual Insight: The image shows a real-time data monitoring panel. Developers can directly view temperature, humidity, light intensity, CO2, and other measurement values, confirming that the gateway acquisition path is working.
After cloud platform deployment, you can use the default device model immediately
YFIOs supports three deployment methods: Docker, Ubuntu, and Windows. Docker is the best option for fast validation. After deployment, the platform automatically creates device and product instances, such as the default gateway and environmental monitoring device. This means developers do not need to define the entire thing model from scratch.
This prebuilt and ready-to-use design significantly reduces the time required for the first IoT proof of concept, especially for industry prototypes, teaching labs, and small to medium-sized projects.
# Example deployment flow with Docker
# 1. Prepare a server or industrial PC
# 2. Install the Docker environment
# 3. Start YFIOs services according to the official documentation
# 4. Log in to the platform and verify whether the default devices were created automatically
This sample sequence summarizes the minimum validation path after platform deployment.
 AI Visual Insight: The image shows the default device list or the platform initialization result, indicating that the system has automatically preinstalled products, devices, and base models, which reduces manual modeling work.
The cloud management tool is responsible for configuration import and connection validation
The YFIOs cloud management tool functions as a project-level control console. It binds to the platform using an AccessKey ID, AccessKey Secret, and server address, and it also supports direct import of XML configuration files.
Using platform-generated credentials is the recommended approach because it works better for team collaboration, permission isolation, and later project migration. After the connection succeeds, the tool displays a Connected status, which serves as a prerequisite validation before the gateway goes to the cloud.
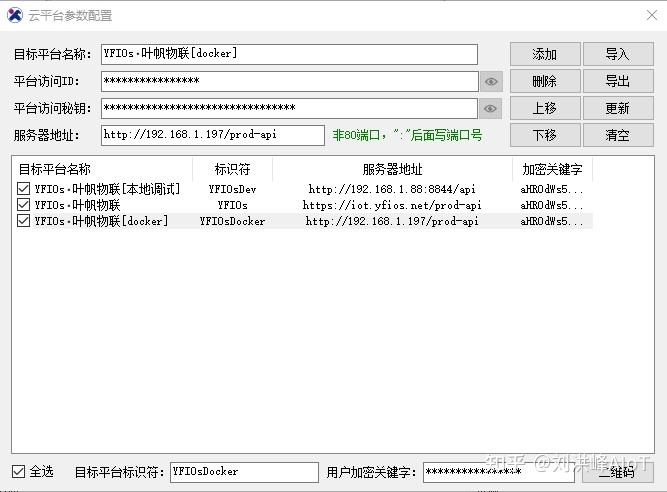 AI Visual Insight: The image shows the cloud platform parameter configuration window, which typically includes fields such as access ID, access secret, and server address. This indicates that the tool uses a key-based, project-level authentication mechanism.
The key to gateway cloud onboarding is keeping the identity quartet and connection strategy consistent
When onboarding the YF3028 to the cloud, you need the identity quartet: project ID, product ID, device ID, and device key. As the gateway device, the YF3028 and its downstream Hexa-Tower sub-device should each have their own identity information. This avoids the common issue where the gateway is online but the sub-device has no data.
After adding a Yefan IoT client connection strategy in the edge intelligence tool, fill in the corresponding identity quartet and deploy the engine to establish the channel from edge to cloud.
{
  "projectId": "Sample Project ID",
  "productId": "YF3028 or SixCubicT",
  "deviceId": "Sample Device ID",
  "deviceKey": "Sample Device Key"
}
This configuration example shows the minimum identity set required for cloud onboarding. In practice, retrieve the actual values from the platform or cloud management tool.
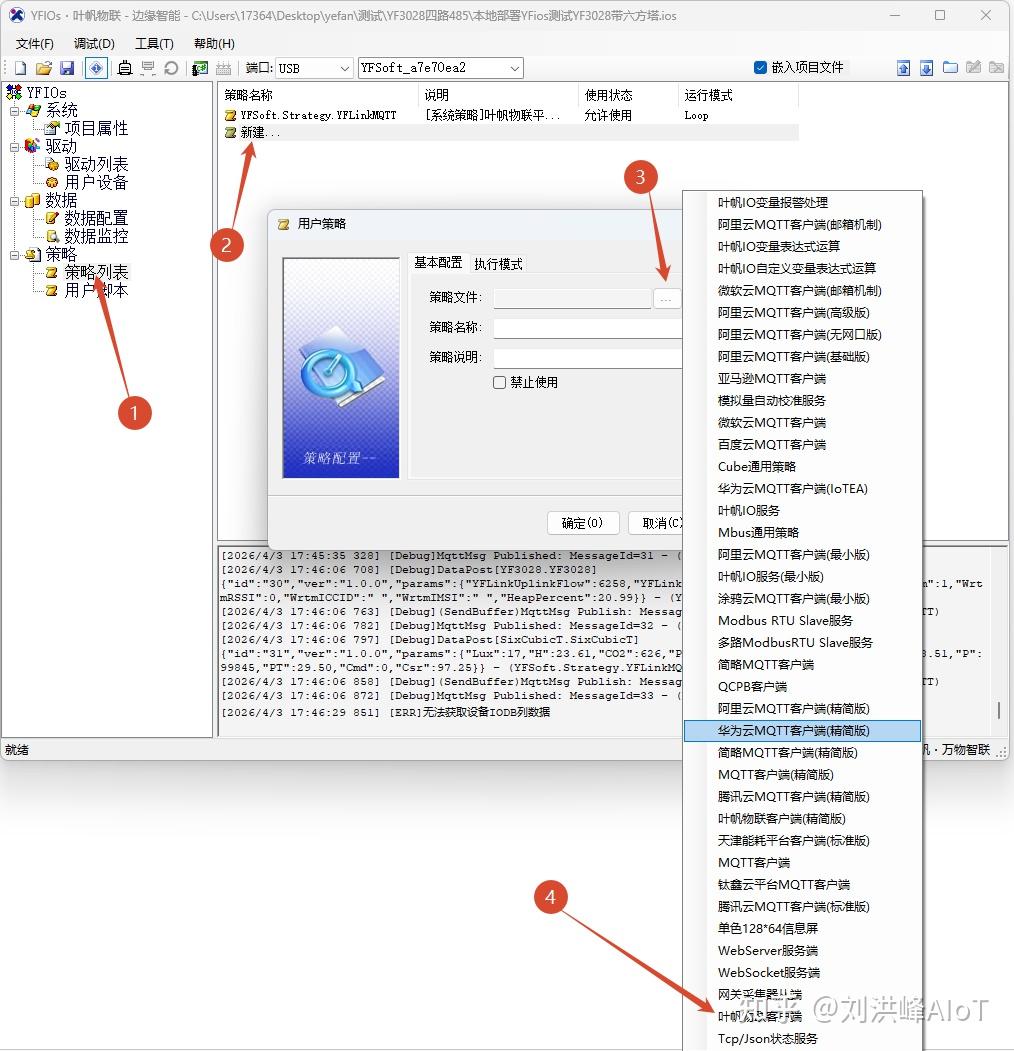 AI Visual Insight: The image shows the strategy management interface or the screen for creating a new connection strategy. It highlights that the gateway must create a platform connection object and bind authentication parameters before going online.
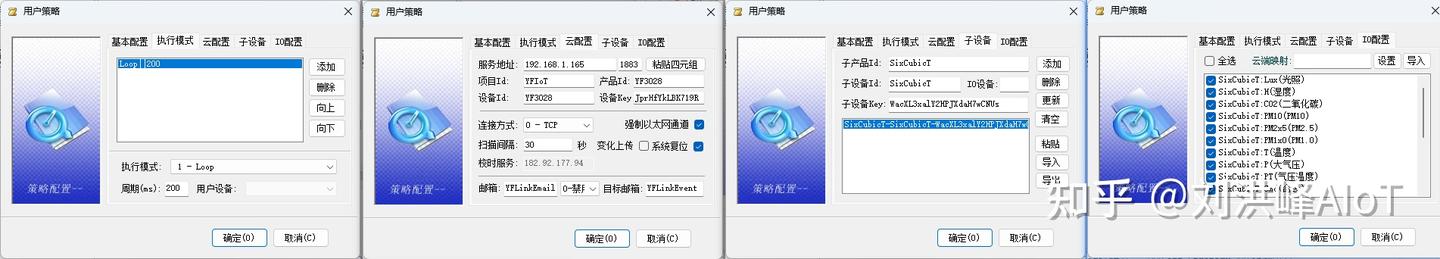 AI Visual Insight: This image likely shows detailed connection parameters or protocol instance configuration, emphasizing the mapping between project, product, device identity, and the server address.
Once data reaches the cloud, it becomes queryable, analyzable, and exportable
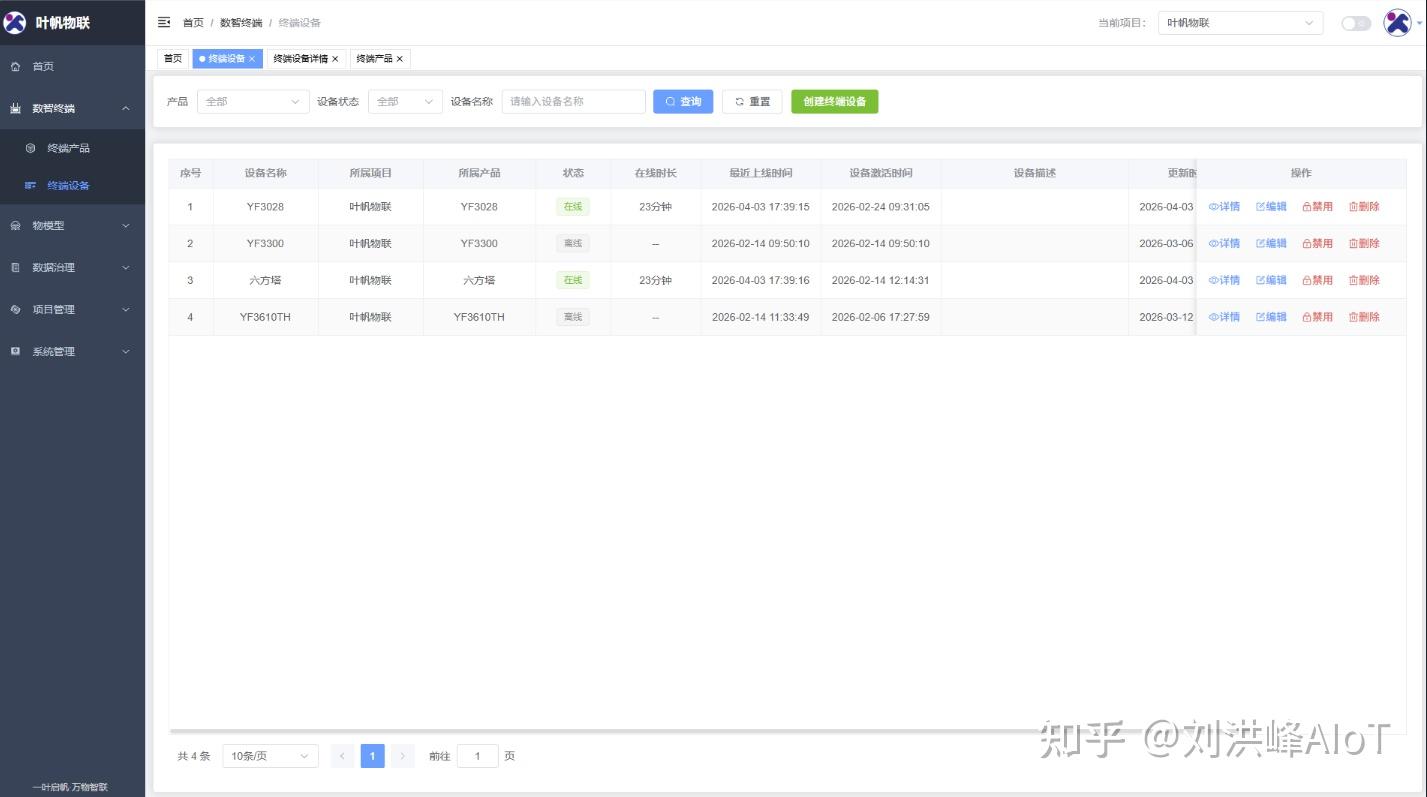
After the connection succeeds, developers can use the cloud tool to inspect device online status, real-time data, historical data, and historical trends. Online status answers whether the device is connected. Historical trends answer how the data changes over time.
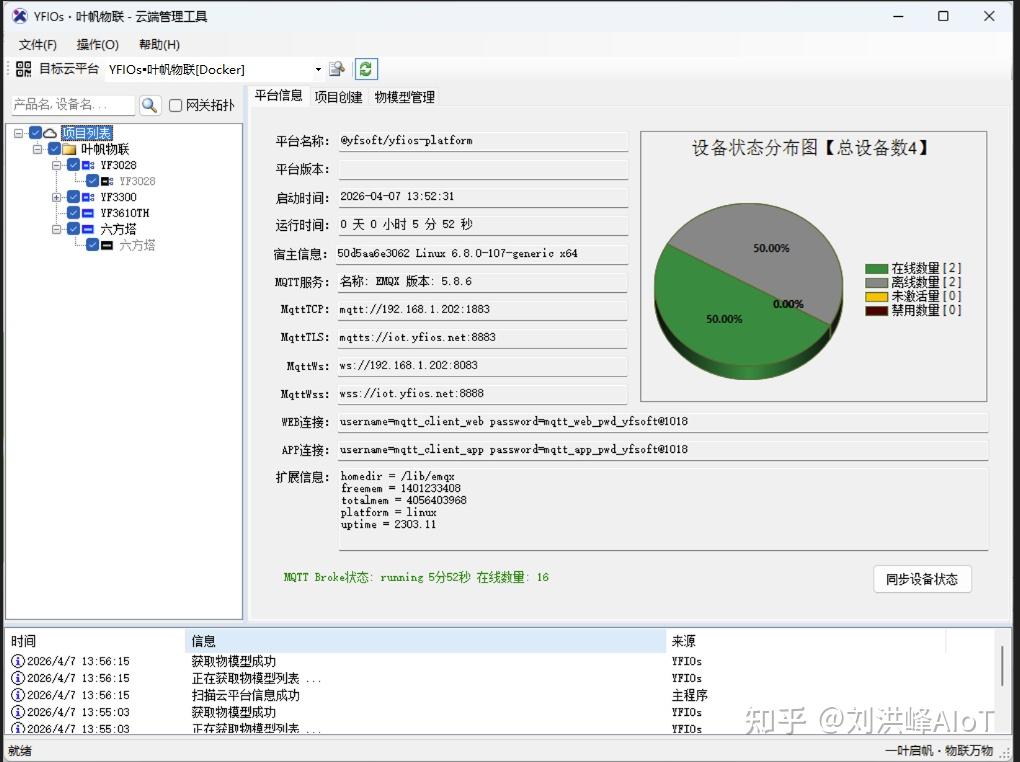 AI Visual Insight: The image shows the device online status panel, typically including the device name, connection status, and timestamp, which helps determine whether the gateway and sub-device have successfully connected to the cloud platform.
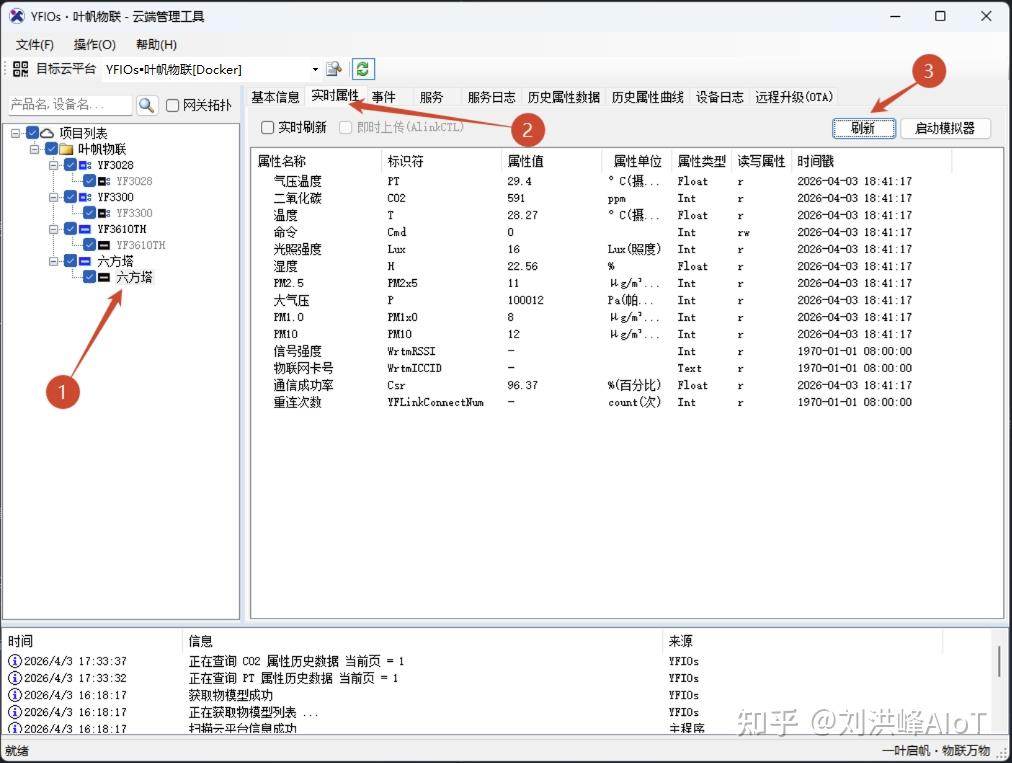 AI Visual Insight: The image shows the cloud-side real-time data monitoring interface, indicating that sampled values have been continuously uploaded from the edge gateway to the platform and successfully parsed for display.
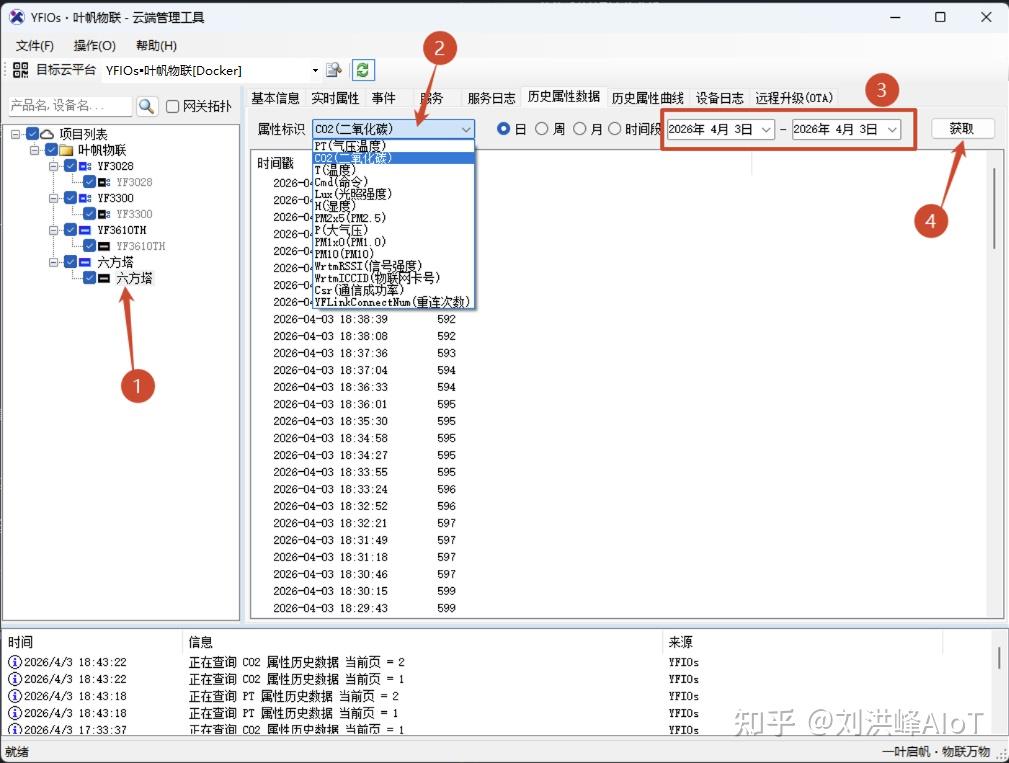 AI Visual Insight: The image shows the historical data list view, where measurement values are typically stored in time-series table format for auditing, traceability, and interval queries.
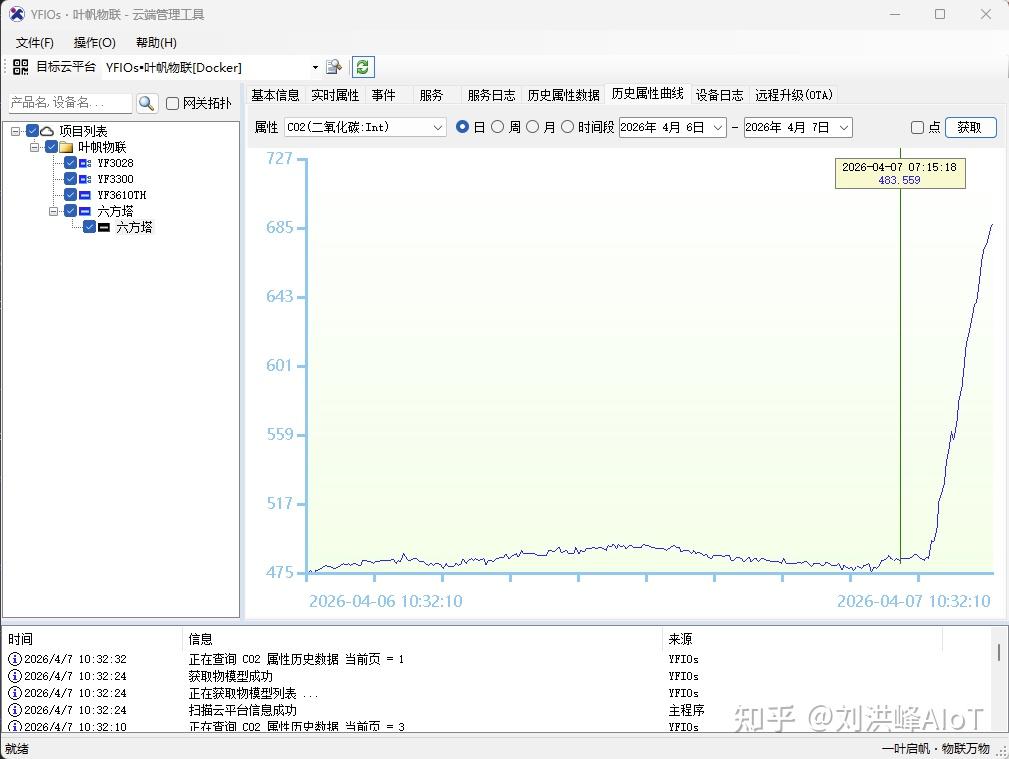 AI Visual Insight: The image shows the historical trend chart, which visually reveals fluctuations across multiple environmental parameters and is useful for anomaly detection, threshold analysis, and operational evaluation.
Data points are the prerequisite for historical storage and report export
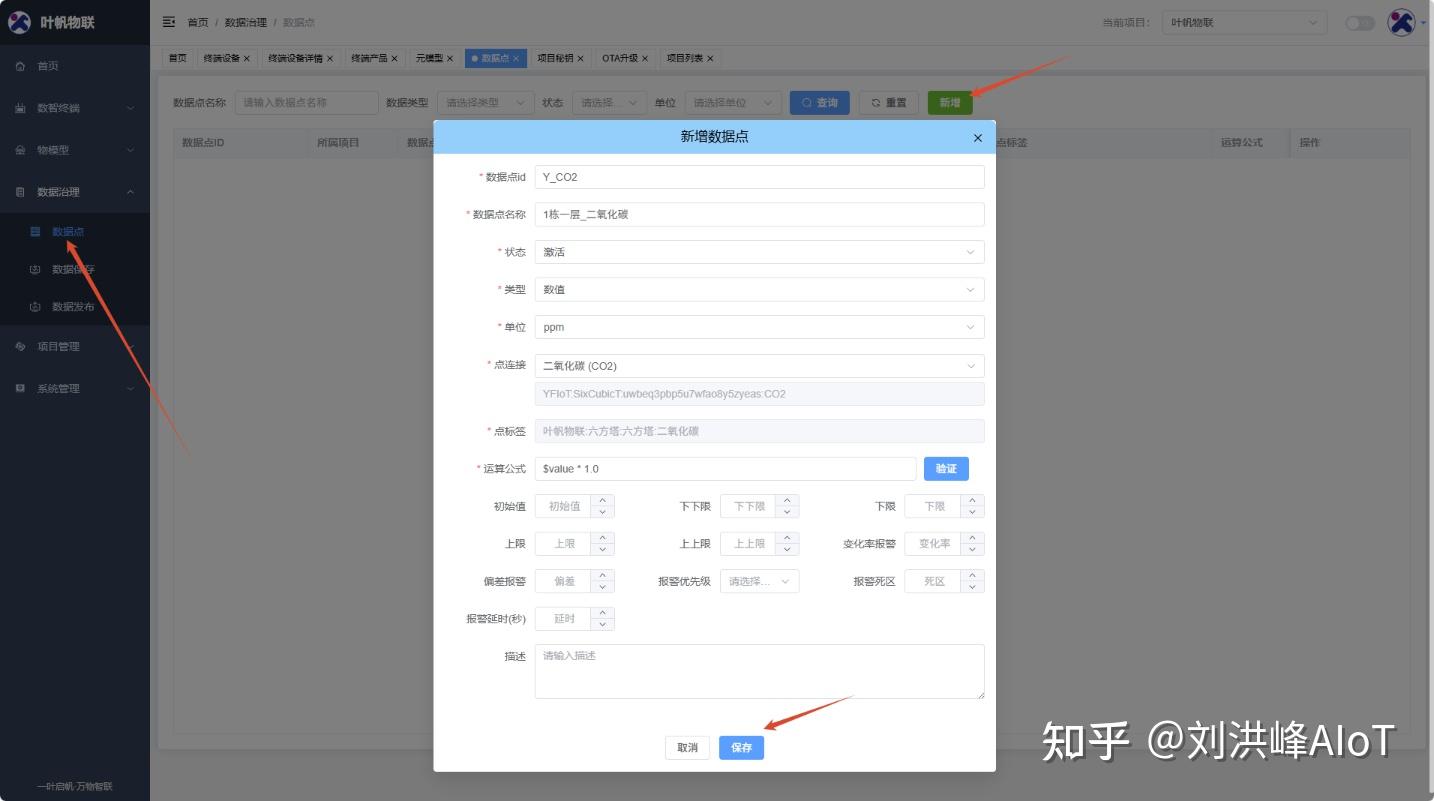
If you want to retain long-term data, you must create data points in the platform. A data point is effectively the definition of a persisted measurement. It determines which attributes enter time-series storage and which fields can be queried and exported.
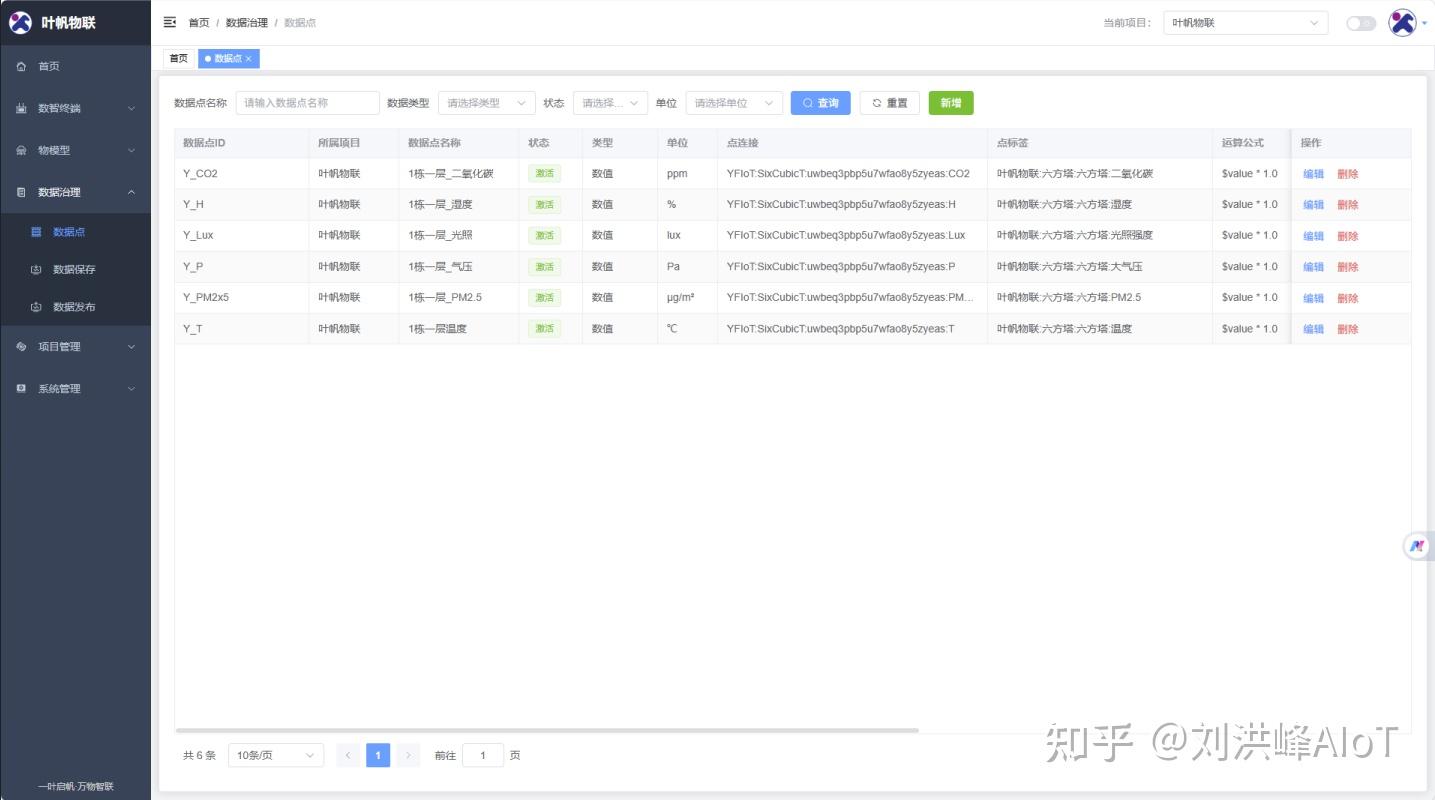
 AI Visual Insight: The image shows the data point management entry or list, indicating that the platform uses a configurable data governance mechanism to decide which sensor fields are included in long-term storage.
 AI Visual Insight: The image shows the data point configuration form, where developers can set display names, field mappings, or storage rules. This step directly affects later historical queries and report export capabilities.
Excel export moves IoT data into the business analytics pipeline
One practical capability in YFIOs is exporting historical data directly to Excel. This matters in operations, agriculture, environmental protection, energy management, and similar scenarios because many business teams do not work directly in IoT platforms. Instead, they rely on spreadsheets for reporting, archiving, and secondary analysis.
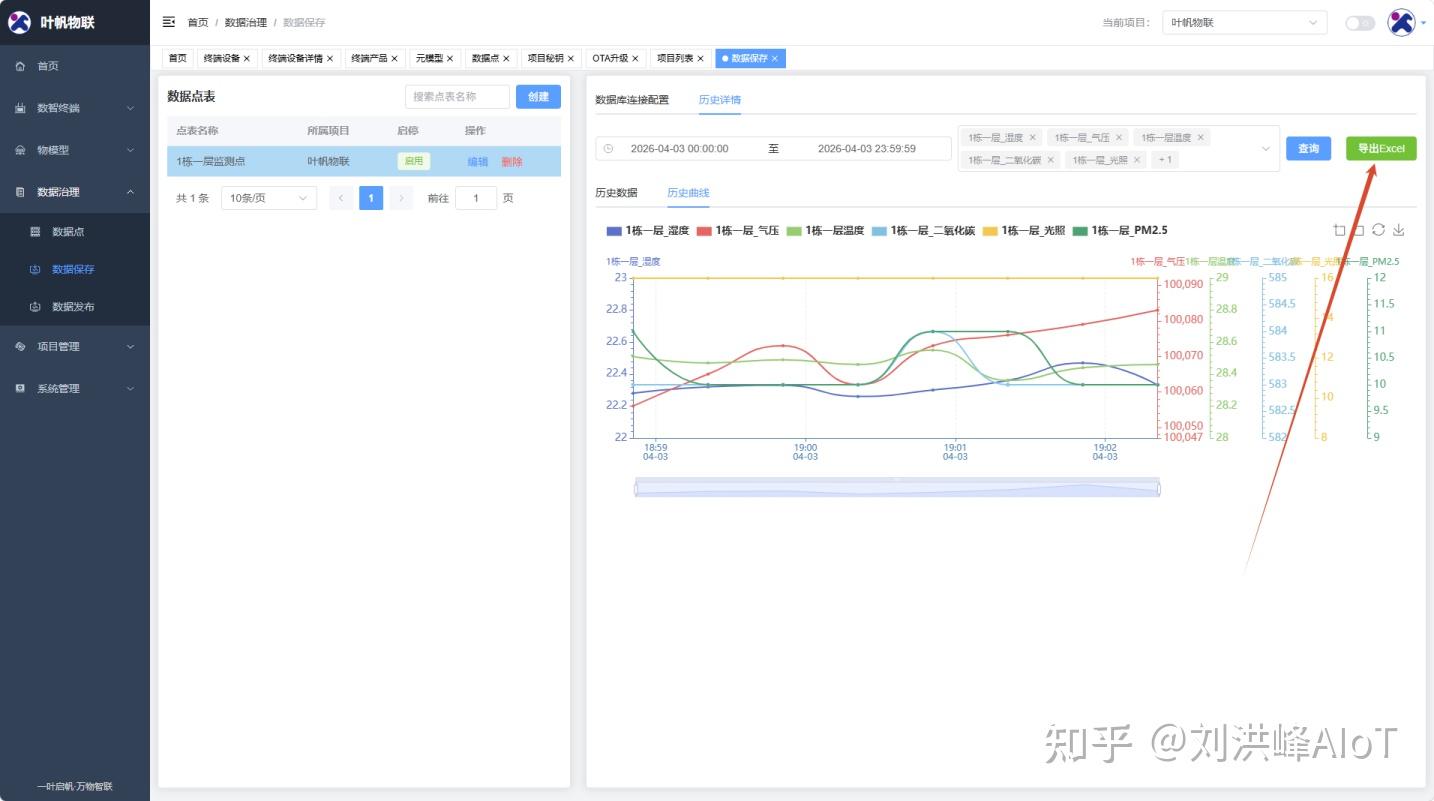 AI Visual Insight: The image shows the data export entry point, indicating that the platform already provides a low-friction reporting workflow for business users rather than offering only developer-facing APIs.
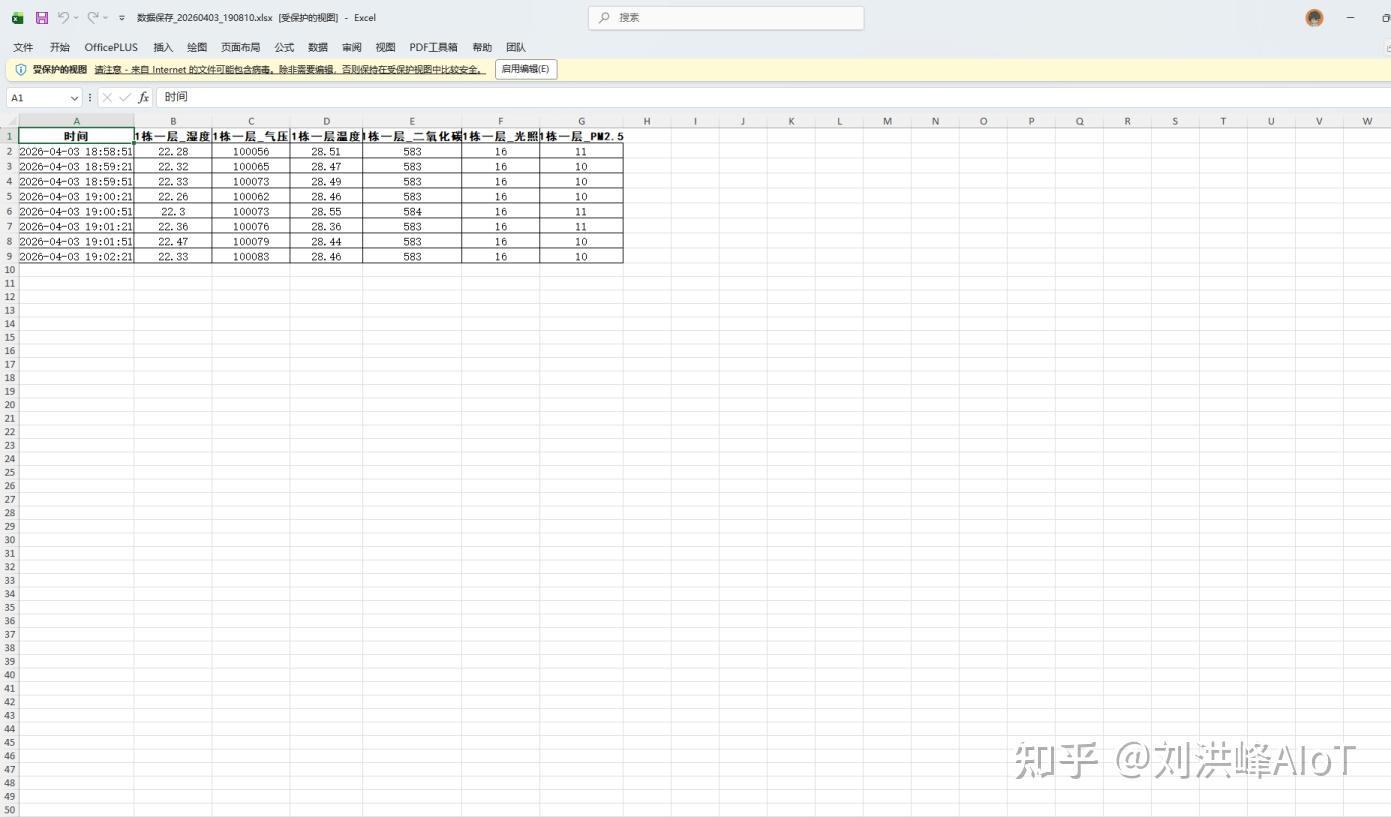 AI Visual Insight: The image shows a sample exported Excel file, usually including columns such as timestamp, measurement name, and value. This indicates that the platform has transformed device time-series data into a standard reporting format.
# Example: continue performing secondary analysis on exported Excel data
import pandas as pd

# Read the report file exported from the platform
file_path = "yfios_history.xlsx"
df = pd.read_excel(file_path)

# Calculate the average value of a sensor for operations analysis
avg_value = df["温度"].mean()
print(f"温度 average value: {avg_value}")
This code shows that Excel export is not the end of the workflow. It is the starting point for BI, reporting, and algorithmic analysis.
YFIOs is a strong fit for IoT projects that need a fast device-to-edge-to-cloud path
Based on the workflow in this article, YFIOs is especially suitable for projects where the hardware is already selected and the team wants to complete onboarding and visualization quickly. It combines device access, edge-side debugging, cloud management, trend display, and report output in one unified system.
For developers, the most important factor is not the number of interfaces. It is the determinism of the pipeline: whether sensors can be collected reliably, whether the gateway can complete identity authentication, and whether the platform can form persistent data assets. YFIOs provides a relatively short path to production readiness.
FAQ structured answers
1. Why can the edge tool see data while the cloud platform shows no data?
This is usually caused by an incorrect identity quartet, a connection strategy that was not deployed correctly, or mixed identities between the gateway and sub-device. First verify that the project ID, product ID, device ID, and device key map one-to-one to the actual device identities.
2. Why can’t I see historical trends after creating the device?
A device being online does not mean the data is persisted. If you do not create data points, the platform can only display real-time values and cannot generate historical records or trend analysis results.
3. Which deployment method does YFIOs recommend?
For the validation stage, Docker is the preferred option because deployment is fast and rollback is simple. If you need deeper system integration, choose Ubuntu or Windows. The key factor is not the operating system. It is network reachability, storage planning, and device credential management.
Core Summary: Using the Hexa-Tower environmental monitoring device and the YF3028 gateway, this article reconstructs the complete YFIOs workflow from edge acquisition and gateway cloud onboarding to platform modeling, historical trends, and Excel export, helping developers quickly implement industrial IoT data collection and analysis.