This Django-based second-hand housing data visualization and analytics system centers on listing search, multidimensional chart analysis, personalized recommendations, and house price prediction. It addresses fragmented resale housing information, difficulty in judging prices, and data-poor decision-making. Keywords: Django, ECharts, house price prediction.
Technical Specifications Snapshot
| Parameter | Description |
|---|---|
| Primary Languages | Python, JavaScript, HTML, CSS |
| Web Framework | Django 5.1 |
| Visualization Protocol / Approach | HTTP, server-side rendering, ECharts chart configuration |
| Data Processing | Pandas, NumPy |
| Machine Learning | Scikit-learn Linear Regression |
| Database | SQLite |
| Text Processing | Jieba |
| Star Count | Not provided in the source |
| Core Dependencies | Django, Pandas, NumPy, ECharts, Scikit-learn |
This system covers the full path from data browsing to decision support
At its core, this project is a lightweight implementation of a real estate data platform. The frontend displays listings, statistics, and charts, while the backend handles filtering, aggregation, recommendation, and prediction. It is well suited for coursework, capstone prototypes, and validation of small to mid-sized data products.
The system is organized into five layers: user management, listing search, behavior tracking, visualization analytics, and intelligent decision support. This structure closes the loop between viewing data and acting on data, rather than stopping at static reporting.
User authentication and profile management ensure baseline usability
The login and registration flow uses Django view functions to handle requests directly, including session writes, account creation, and profile maintenance. The original implementation is simple and straightforward, but plaintext password verification introduces security risks. In production, you should replace it with Django’s built-in authentication system.
def login_view(request):
    if request.method == 'POST':
        username = request.POST.get('name')
        password = request.POST.get('password')
        # Verify whether the username and password match
        user = User.objects.filter(username=username, password=password).first()
        if user:
            # Write core user information into the session for reuse across later pages
            request.session['username'] = {
                'username': user.username,
                'avatar': str(user.avatar)
            }
            return redirect('index')
    return render(request, 'login.html')
This code implements a minimally viable login flow, but it should be strengthened with password hashing, form validation, and CSRF protection.
The homepage serves both listing search and market overview
The homepage combines search, type filtering, city filtering, and baseline statistics. It becomes the user’s first decision dashboard after entering the system. Its core value is not the listing view itself, but the way it transforms scattered property records into a comparable information view.
def index(request):
    houses = House.objects.all().distinct()
    search_query = request.GET.get('search', '')
    selected_type = request.GET.get('house_type', '')
    selected_city = request.GET.get('city', '')

    if search_query:
        # Perform fuzzy matching against title, location, and community name
        houses = houses.filter(
            Q(title__icontains=search_query) |
            Q(location__icontains=search_query) |
            Q(community__icontains=search_query)
        )
    if selected_type:
        houses = houses.filter(house_type=selected_type)
    if selected_city:
        houses = houses.filter(city=selected_city)

    return render(request, 'index.html', {'houses': houses})
This code enables dynamic filtering on the homepage and provides the data foundation for downstream statistics dashboards and recommendation entry points.
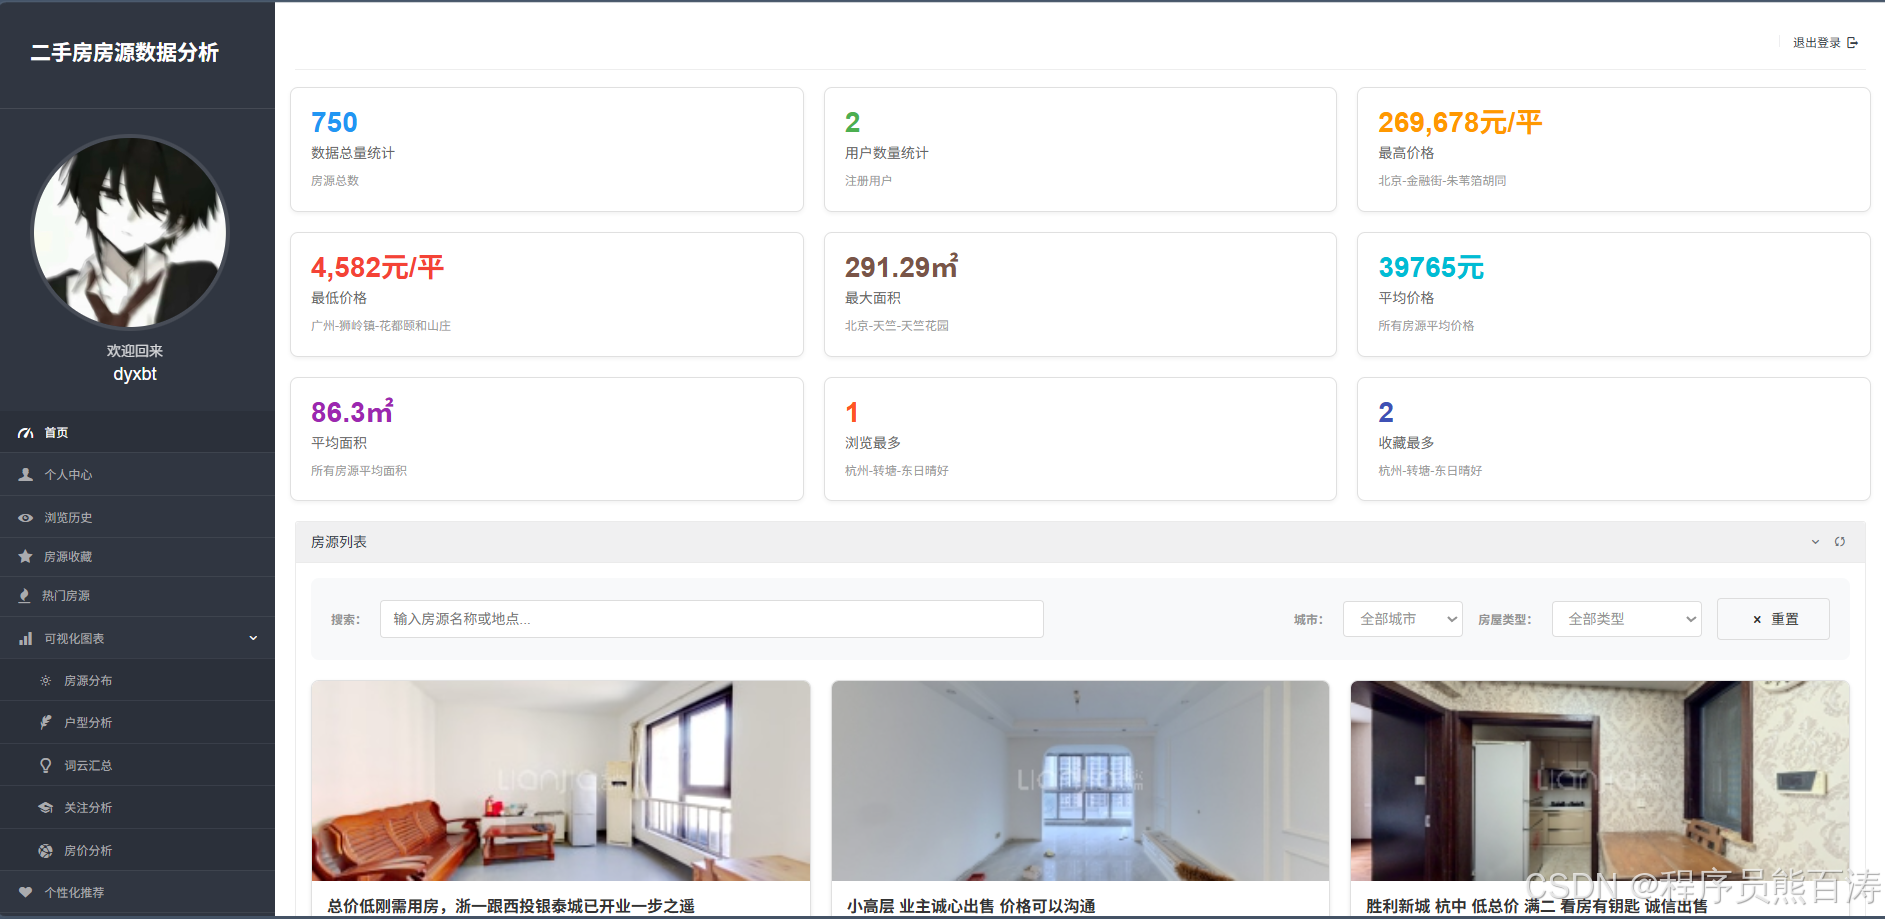 AI Visual Insight: The image shows a large-screen homepage layout for a property listing system, typically including a top search area, key metric cards, a popular listings section, and chart components. Technically, it reflects a combination of Django template rendering and embedded ECharts components on the frontend, making it suitable for displaying aggregated results after real-time filtering.
Behavioral data provides training signals for the recommendation system
Browsing history and favorites are not just user experience features. They also provide behavioral features for the recommendation system. Browse duration, favorite actions, and follow counts can all be mapped into implicit feedback signals to infer preferred areas, floor plans, and price ranges.
In the original project, history records and favorites are maintained in separate tables and linked to listings through the user ID. This structure already satisfies the minimum data requirements for collaborative filtering or rule-based recommendation, and a weighting mechanism can be added later to improve recommendation accuracy.
Five visualization pages form the analytical core of the system
The listing distribution page counts cities and districts, making it useful for answering “Where are the most listings?” The floor plan analysis page links city, district, layout, and average price, helping answer “Which floor plans are more common, and what are their average prices?” The word cloud page highlights high-frequency terms. The attention analysis page reveals the relationship between popularity and price bands. The price analysis page shows average district prices and the scatter relationship between floor area and total price.
def house_distribute(request):
    type_name = request.GET.get('type_name')
    houses = House.objects.filter(house_type=type_name) if type_name else House.objects.all()
    city_count = {}
    for item in houses:
        # Accumulate listing counts for each city for pie charts or bar charts
        city_count[item.city] = city_count.get(item.city, 0) + 1
    result = [{'name': k, 'value': v} for k, v in city_count.items()]
    return render(request, 'houseDistribute.html', {'result1': result})
This code demonstrates a typical data aggregation view, with a very clear path from ORM query to chart-ready data structures.
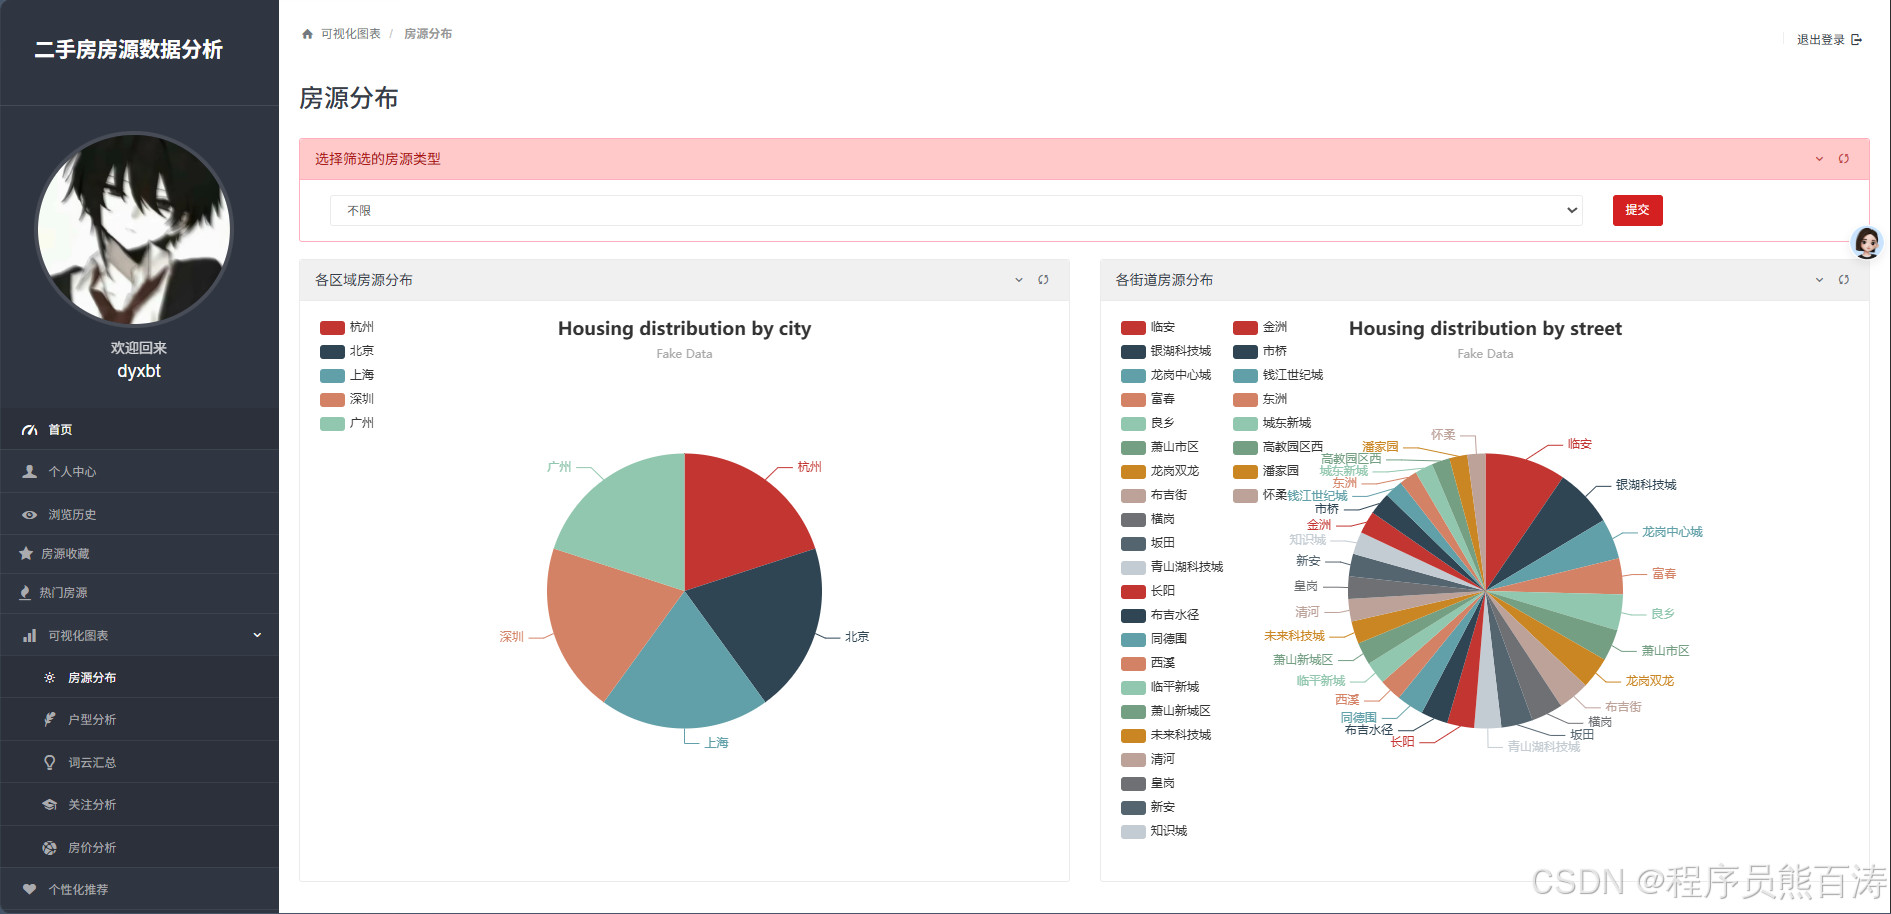 AI Visual Insight: The image corresponds to a geographic distribution view for property listings, typically including a city-level pie chart or map, district ranking bar charts, and a housing type filter. It illustrates how backend aggregate statistics are mapped into frontend chart series and is well suited for quickly identifying areas with concentrated supply.
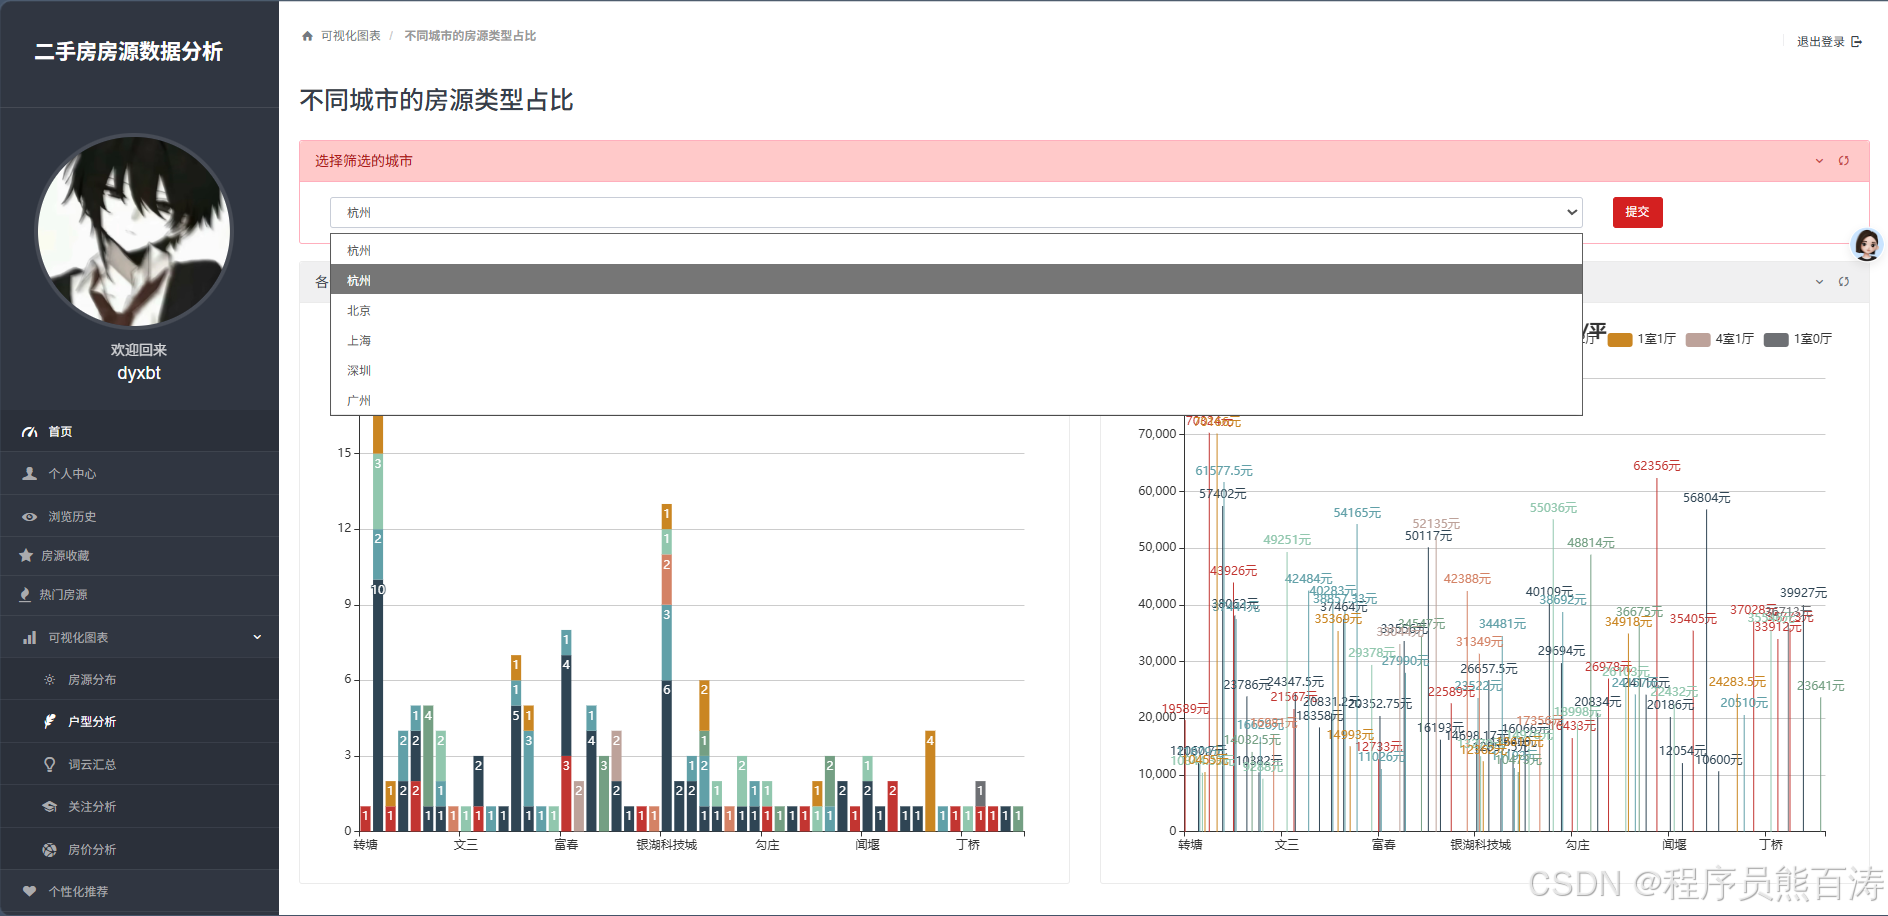 AI Visual Insight: The image shows a combined analysis interface for floor plans, districts, and prices, commonly rendered with stacked bar charts, heatmaps, or grouped bar charts. From a technical perspective, it indicates that the system has already transformed three-dimensional district-layout-average-price data into structured arrays consumable by the frontend.
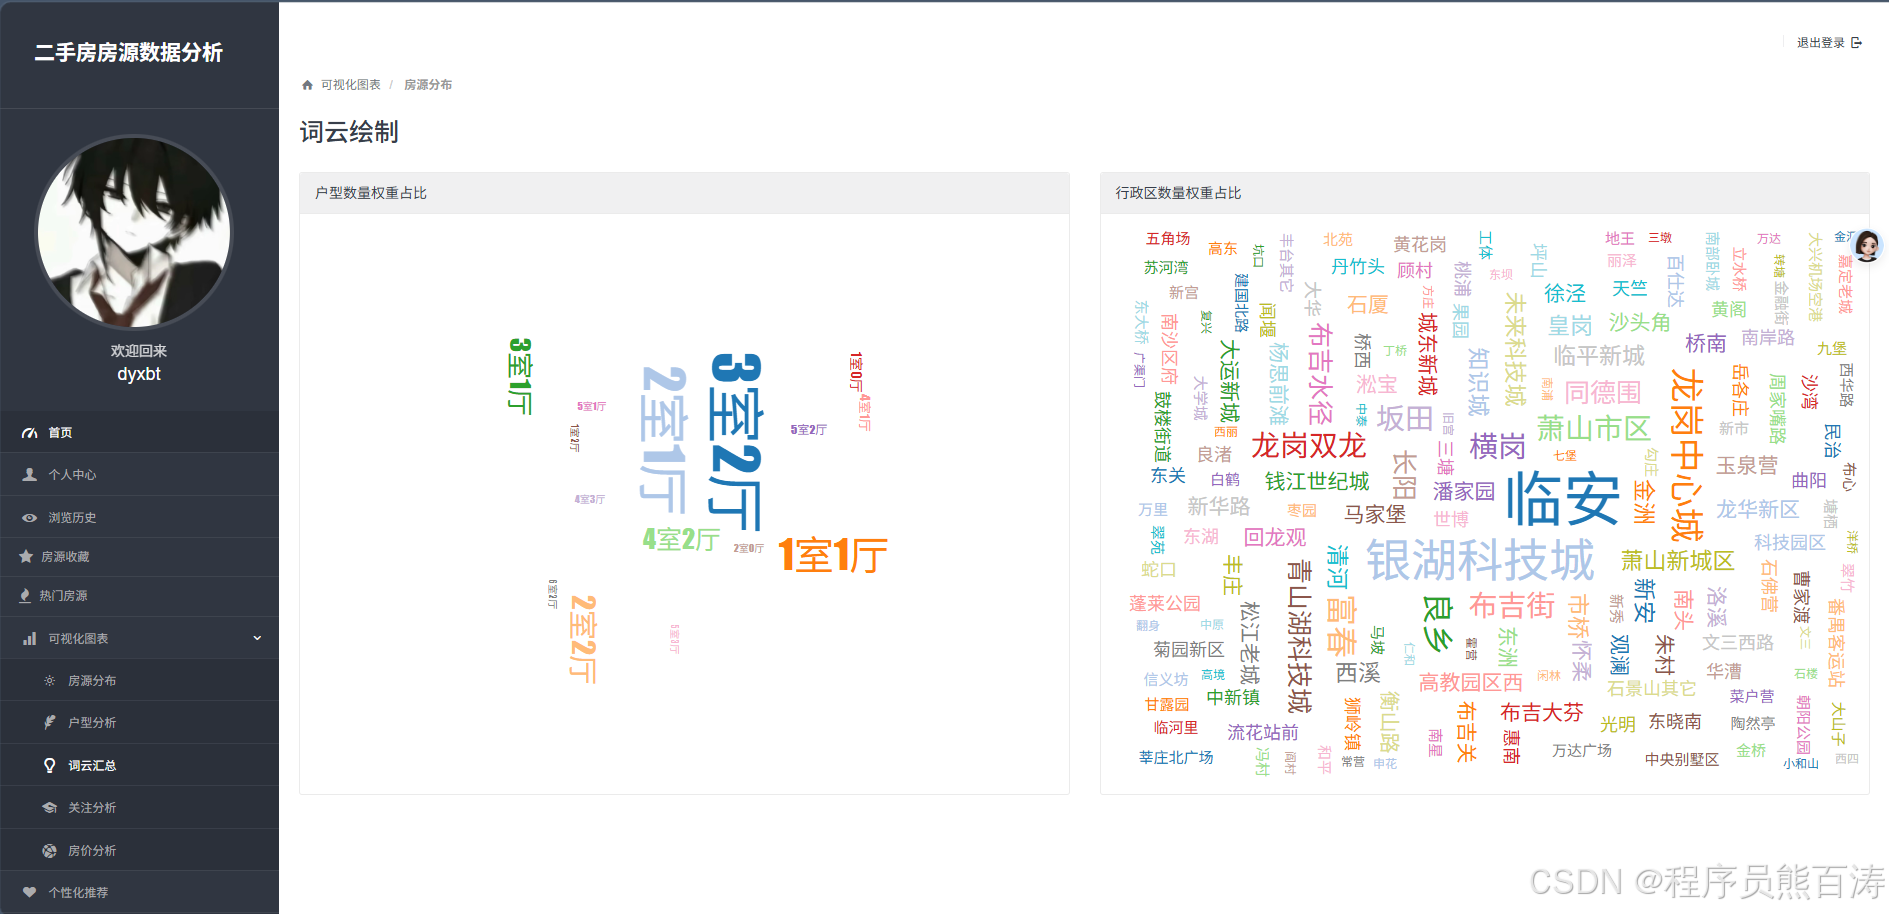 AI Visual Insight: The image shows word clouds for housing types and districts, emphasizing high-frequency tags through visual scaling. It works well for quickly identifying hot areas and mainstream layouts, but it is more descriptive than comparative and is not ideal for precise chart-based comparison.
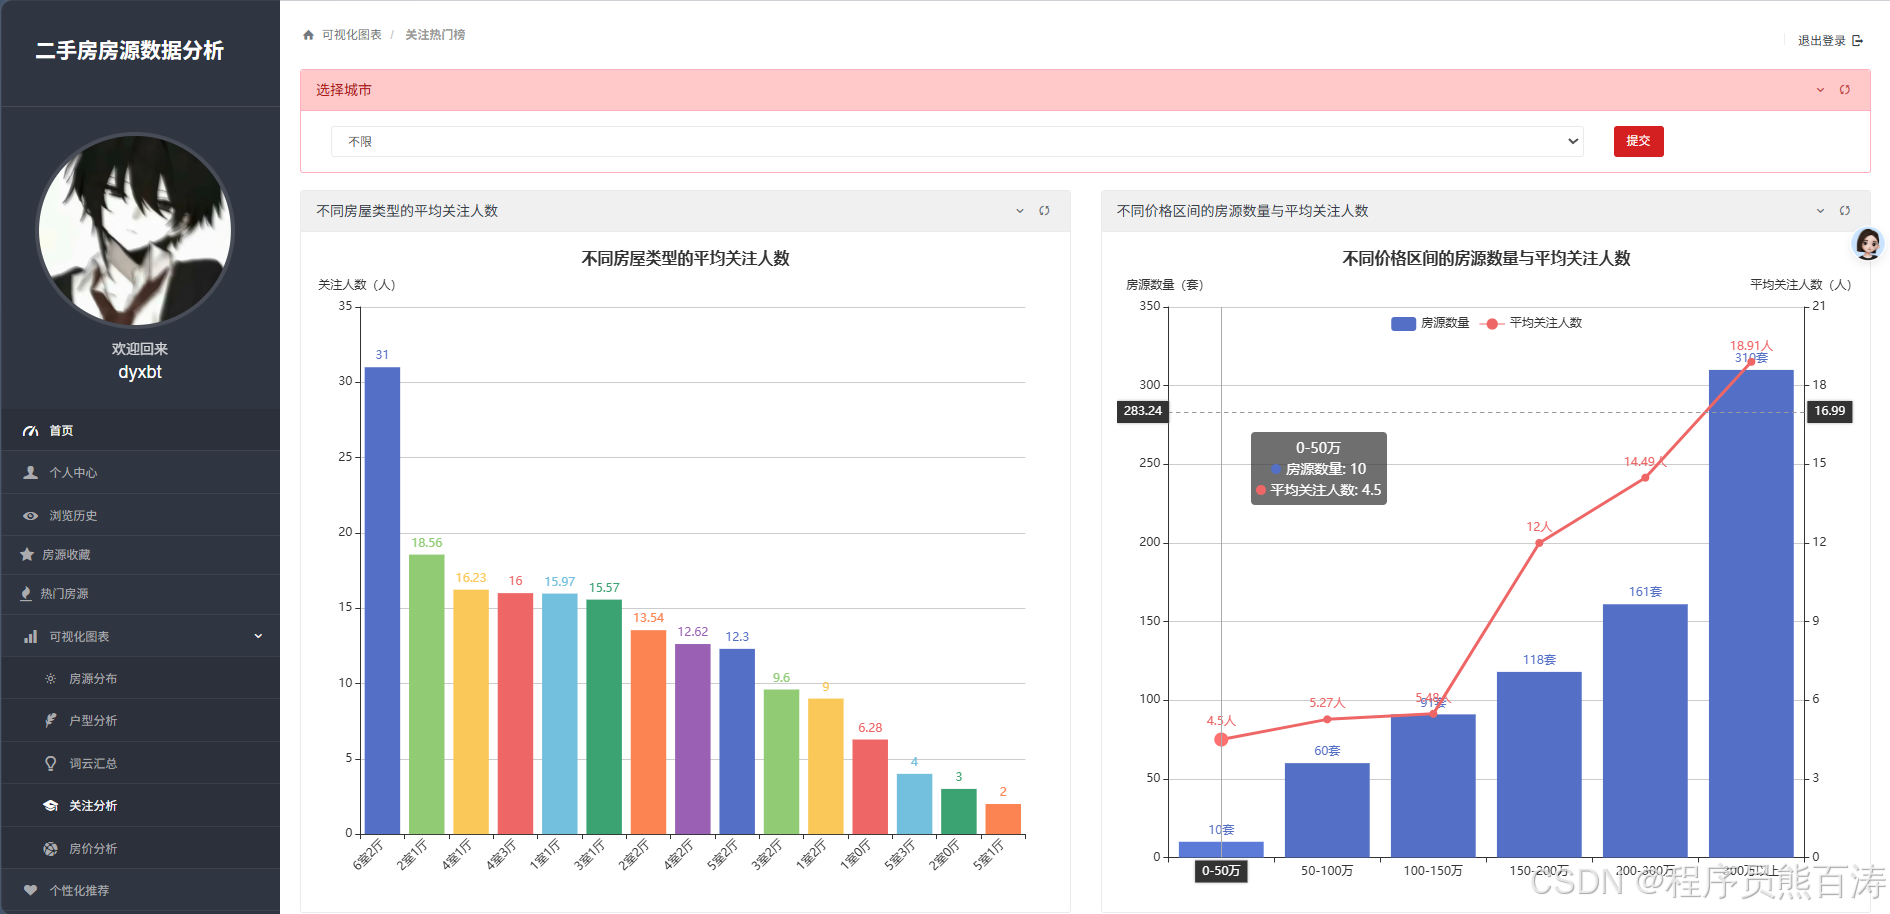 AI Visual Insight: The image reflects statistical results for user attention, often shown as average attention rankings by housing type and attention trends across price ranges. This page indicates that the system has already incorporated the
 attention field into its analytical dimensions, supporting popularity-based decision-making.
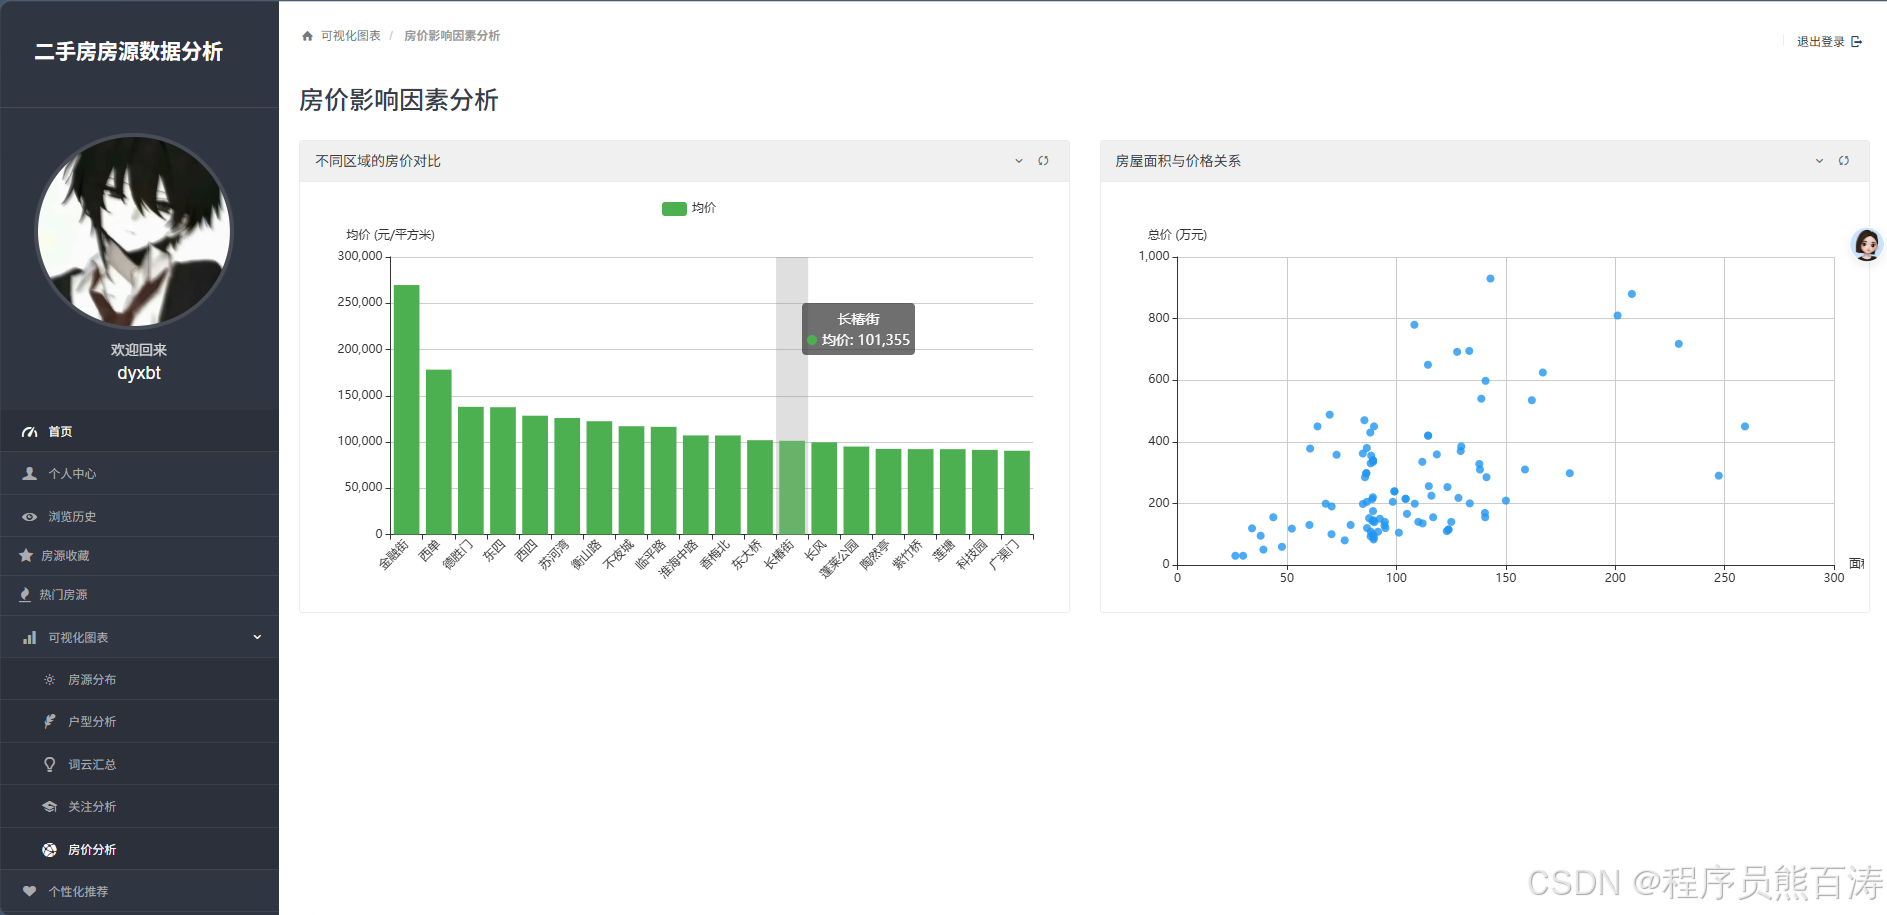 AI Visual Insight: The image shows district average price comparisons and the scatter relationship between floor area and total price. The former supports horizontal comparison of price gradients across districts, while the latter helps identify linear or nonlinear relationships between increasing area and increasing total price, reflecting a basic regression analysis scenario.
Personalized recommendations and house price prediction add intelligent decision-making
The recommendation module calls hybrid_recommend(user.id, top_n=15), which suggests that the original project defines a hybrid recommendation interface. Even when no recommendation results are returned, the system falls back to the most-followed listings so the page always has content to display.
The house price prediction module uses linear regression and applies one-hot encoding to location and house_type before training the model. This approach is interpretable and lightweight to deploy, but its predictive power is limited by the feature set. It cannot fully model more complex factors such as renovation level, orientation, floor number, and build year.
from sklearn.linear_model import LinearRegression
import pandas as pd

# Train a linear regression model after one-hot encoding categorical features
df = pd.DataFrame(data)
df = pd.get_dummies(df, columns=['location', 'house_type'])
X = df.drop('unit_price', axis=1)
y = df['unit_price']

model = LinearRegression()
model.fit(X, y)
This code completes the smallest end-to-end machine learning loop for house price prediction and works well as an interpretable baseline model for teaching projects.
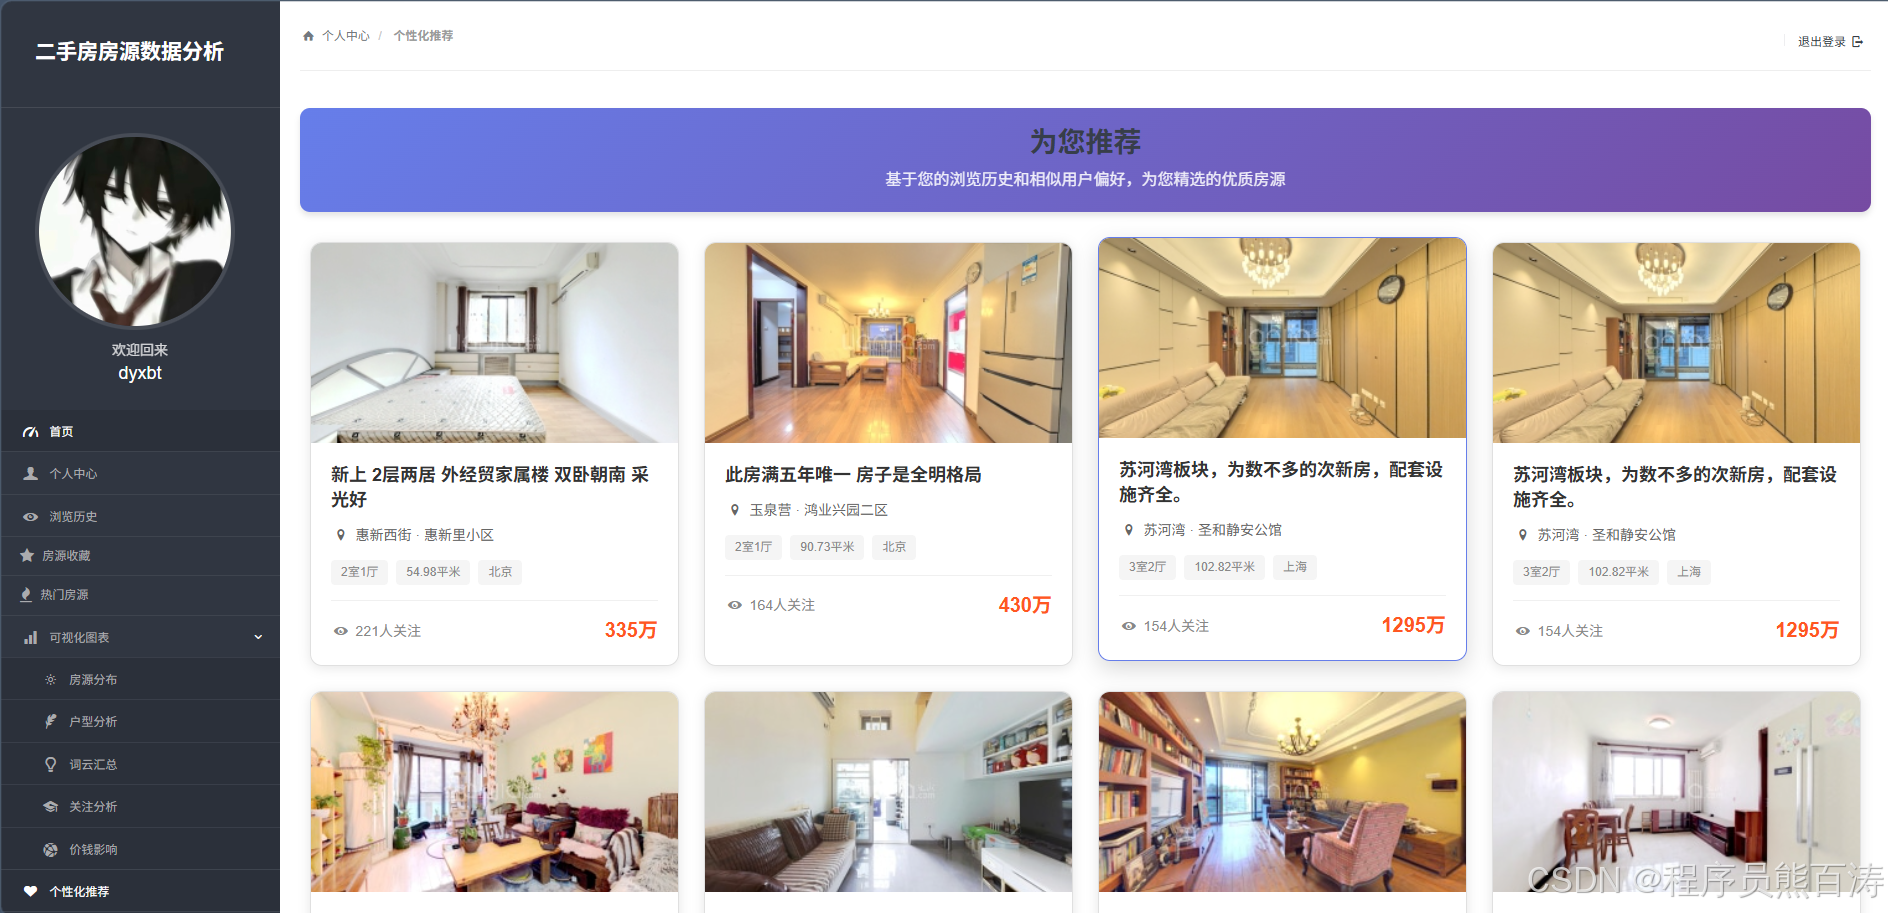 AI Visual Insight: The image shows a recommended listing page, typically presented as a card-based feed containing cover images, prices, districts, and attention metrics. It indicates that recommendation outputs have already moved from the algorithm layer into a consumable product interface.
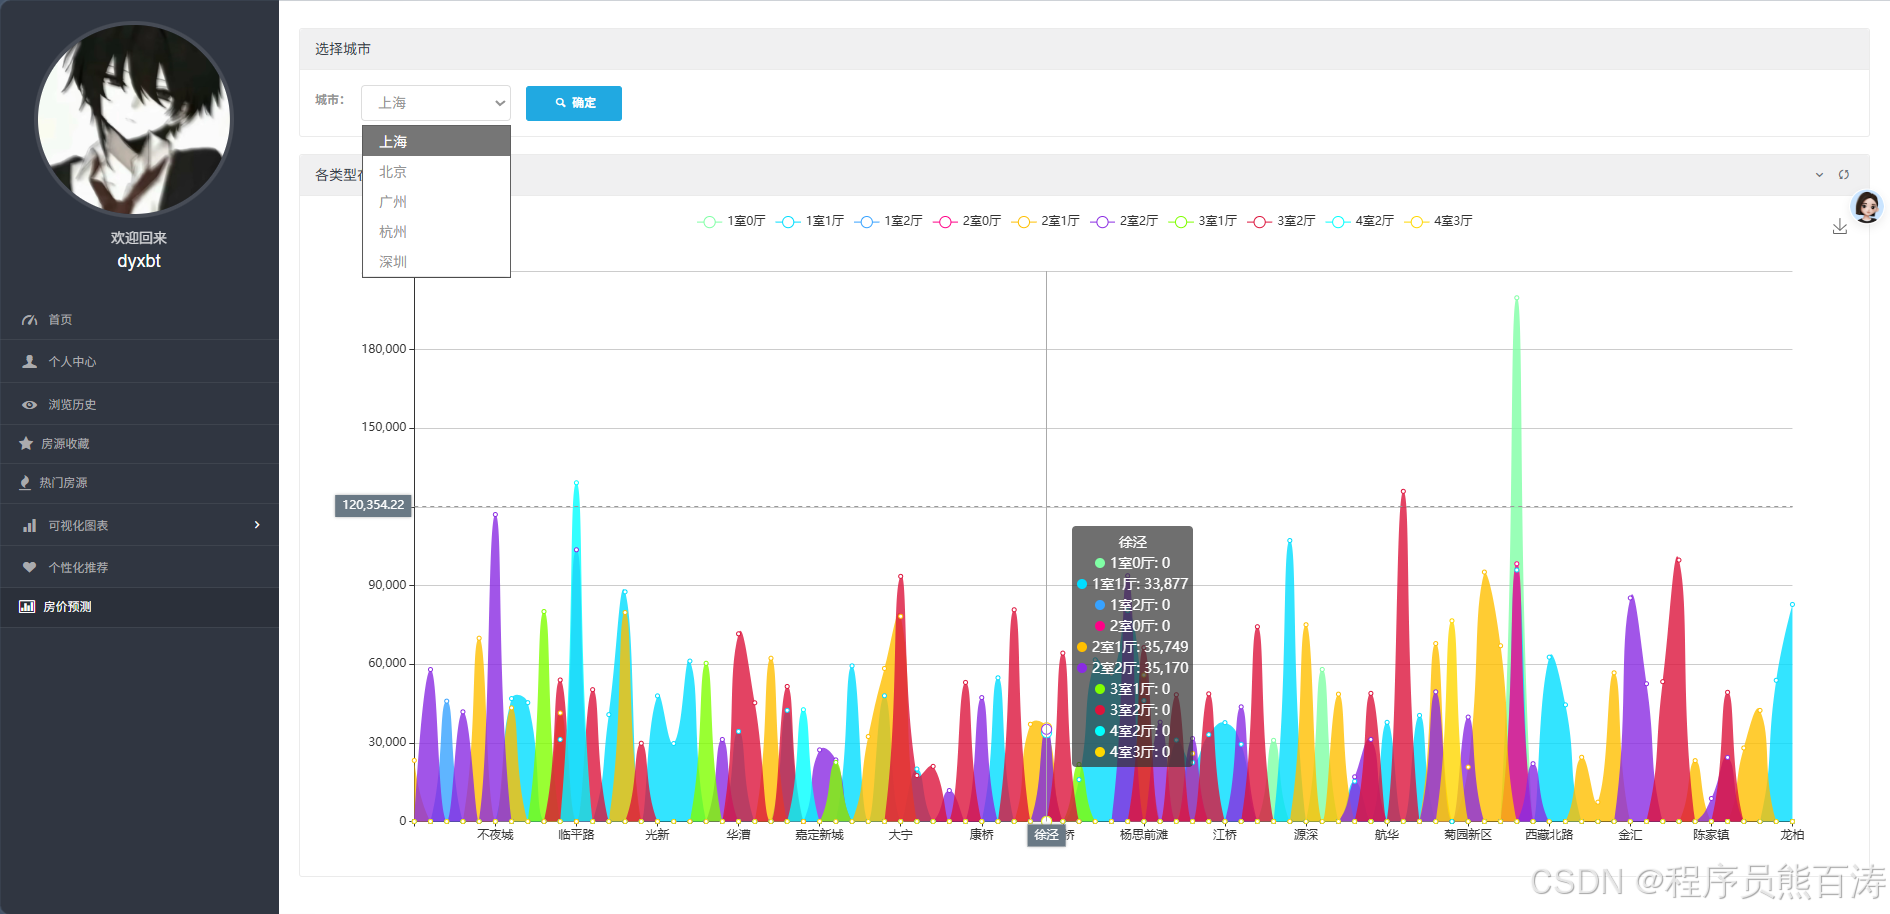 AI Visual Insight: The image corresponds to a prediction results page, typically including city filters, district and floor plan prediction lists, and charts for predicted values. Technically, it shows that model outputs have already been organized into structured prediction results and connected to the frontend for interactive display.
The project’s engineering value outweighs its algorithmic complexity
Its main strength is not state-of-the-art modeling, but end-to-end completeness. It connects data presentation, interactive filtering, behavioral capture, recommendation feedback loops, and prediction output in a single workflow. For developers building web-based data products, preparing a capstone defense, or showcasing projects in a portfolio, this kind of full-stack system is often more persuasive than an isolated algorithm demo.
If you continue evolving the project, prioritize three improvements: integrate Django Auth to rebuild authentication, push aggregate statistics down to the database layer, and add more structured features to recommendation and prediction. These changes will improve security, performance, and trustworthiness at the same time.
FAQ
1. Why is this project a strong fit for a capstone or course project?
Because it combines four capabilities at once: web development, data analysis, visualization, and machine learning. The feature loop is complete, the demo effect is intuitive, and it is easy to demonstrate engineering depth during a presentation or defense.
2. Is linear regression sufficient for house price prediction?
It is sufficient for teaching and prototype validation, but it is usually not enough for production use. To improve accuracy, you should add features such as area, orientation, floor number, renovation level, and build year, and also experiment with models like Random Forest and XGBoost.
3. What parts of the system are most worth optimizing first?
Prioritize authentication security, SQL aggregation efficiency, and the recommendation feature system. The first affects system security, while the latter two directly determine data page performance and the quality of intelligent modules.
AI Readability Summary
This article reconstructs a Django-based resale housing analytics system that includes user management, listing search, ECharts visualization, hybrid recommendation, and linear regression-based house price prediction. It also explains the core implementation logic, key code paths, and practical directions for future expansion.